33
/fr/
AIzaSyAYiBZKx7MnpbEhh9jyipgxe19OcubqV5w
August 1, 2025
88916
Bosnia and Herzegovina
BIH
true
2
1
Net income from abroad (current LCU)
2016,2015,2014,2013,2012,2011,2010,2009,2008,2007,2006,2005,2004,2003,2002,2001,2000,1999,1998,1997,1996,1995
Download
Bibliothèque de statistiques globales →Bosnia and Herzegovina →

Net income from abroad (current LCU)

Cette statistique dans les autres pays:

AfghanistanAlbaniaAlgeriaAndorraAngolaAntigua and BarbudaArgentinaArmeniaAustraliaAustriaAzerbaijanBahamas, TheBahrainBangladeshBarbadosBelarusBelgiumBelizeBeninBermudaBhutanBoliviaBosnia and HerzegovinaBotswanaBrazilBrunei DarussalamBulgariaBurkina FasoBurundiCabo VerdeCambodiaCameroonCanadaCentral African RepublicChadChannel IslandsChileChinaColombiaComorosCongo, Dem. Rep.Congo, Rep.Costa RicaCote d'IvoireCroatiaCubaCyprusCzech RepublicDenmarkDjiboutiDominicaDominican RepublicEcuadorEgypt, Arab Rep.El SalvadorEquatorial GuineaEritreaEstoniaEthiopiaFaroe IslandsFijiFinlandFranceFrench PolynesiaGabonGambia, TheGeorgiaGermanyGhanaGreeceGreenlandGrenadaGuatemalaGuineaGuinea-BissauGuyanaHaitiHondurasHong Kong SAR, ChinaHungaryIcelandIndiaIndonesiaIran, Islamic Rep.IraqIrelandIsraelItalyJamaicaJapanJordanKazakhstanKenyaKiribatiKorea, Rep.KosovoKuwaitKyrgyz RepublicLao PDRLatviaLebanonLesothoLiberiaLibyaLithuaniaLuxembourgMacao SAR, ChinaMacedonia, FYRMadagascarMalawiMalaysiaMaldivesMaliMaltaMarshall IslandsMauritaniaMauritiusMexicoMicronesia, Fed. Sts.MoldovaMonacoMongoliaMontenegroMoroccoMozambiqueMyanmarNamibiaNepalNetherlandsNew CaledoniaNew ZealandNicaraguaNigerNigeriaNorwayOmanPakistanPalauPanamaPapua New GuineaParaguayPeruPhilippinesPolandPortugalPuerto RicoQatarRomaniaRussian FederationRwandaSamoaSao Tome and PrincipeSaudi ArabiaSenegalSerbiaSeychellesSierra LeoneSingaporeSlovak RepublicSloveniaSolomon IslandsSomaliaSouth AfricaSouth SudanSpainSri LankaSt. Kitts and NevisSt. LuciaSt. Vincent and the GrenadinesSudanSurinameSwazilandSwedenSwitzerlandSyrian Arab RepublicTajikistanTanzaniaThailandTimor-LesteTogoTongaTrinidad and TobagoTunisiaTurkeyTurkmenistanTuvaluUgandaUkraineUnited Arab EmiratesUnited KingdomUnited StatesUruguayUzbekistanVanuatuVenezuela, RBVietnamVirgin Islands (U.S.)West Bank and GazaYemen, Rep.ZambiaZimbabwe

La ligne de temps

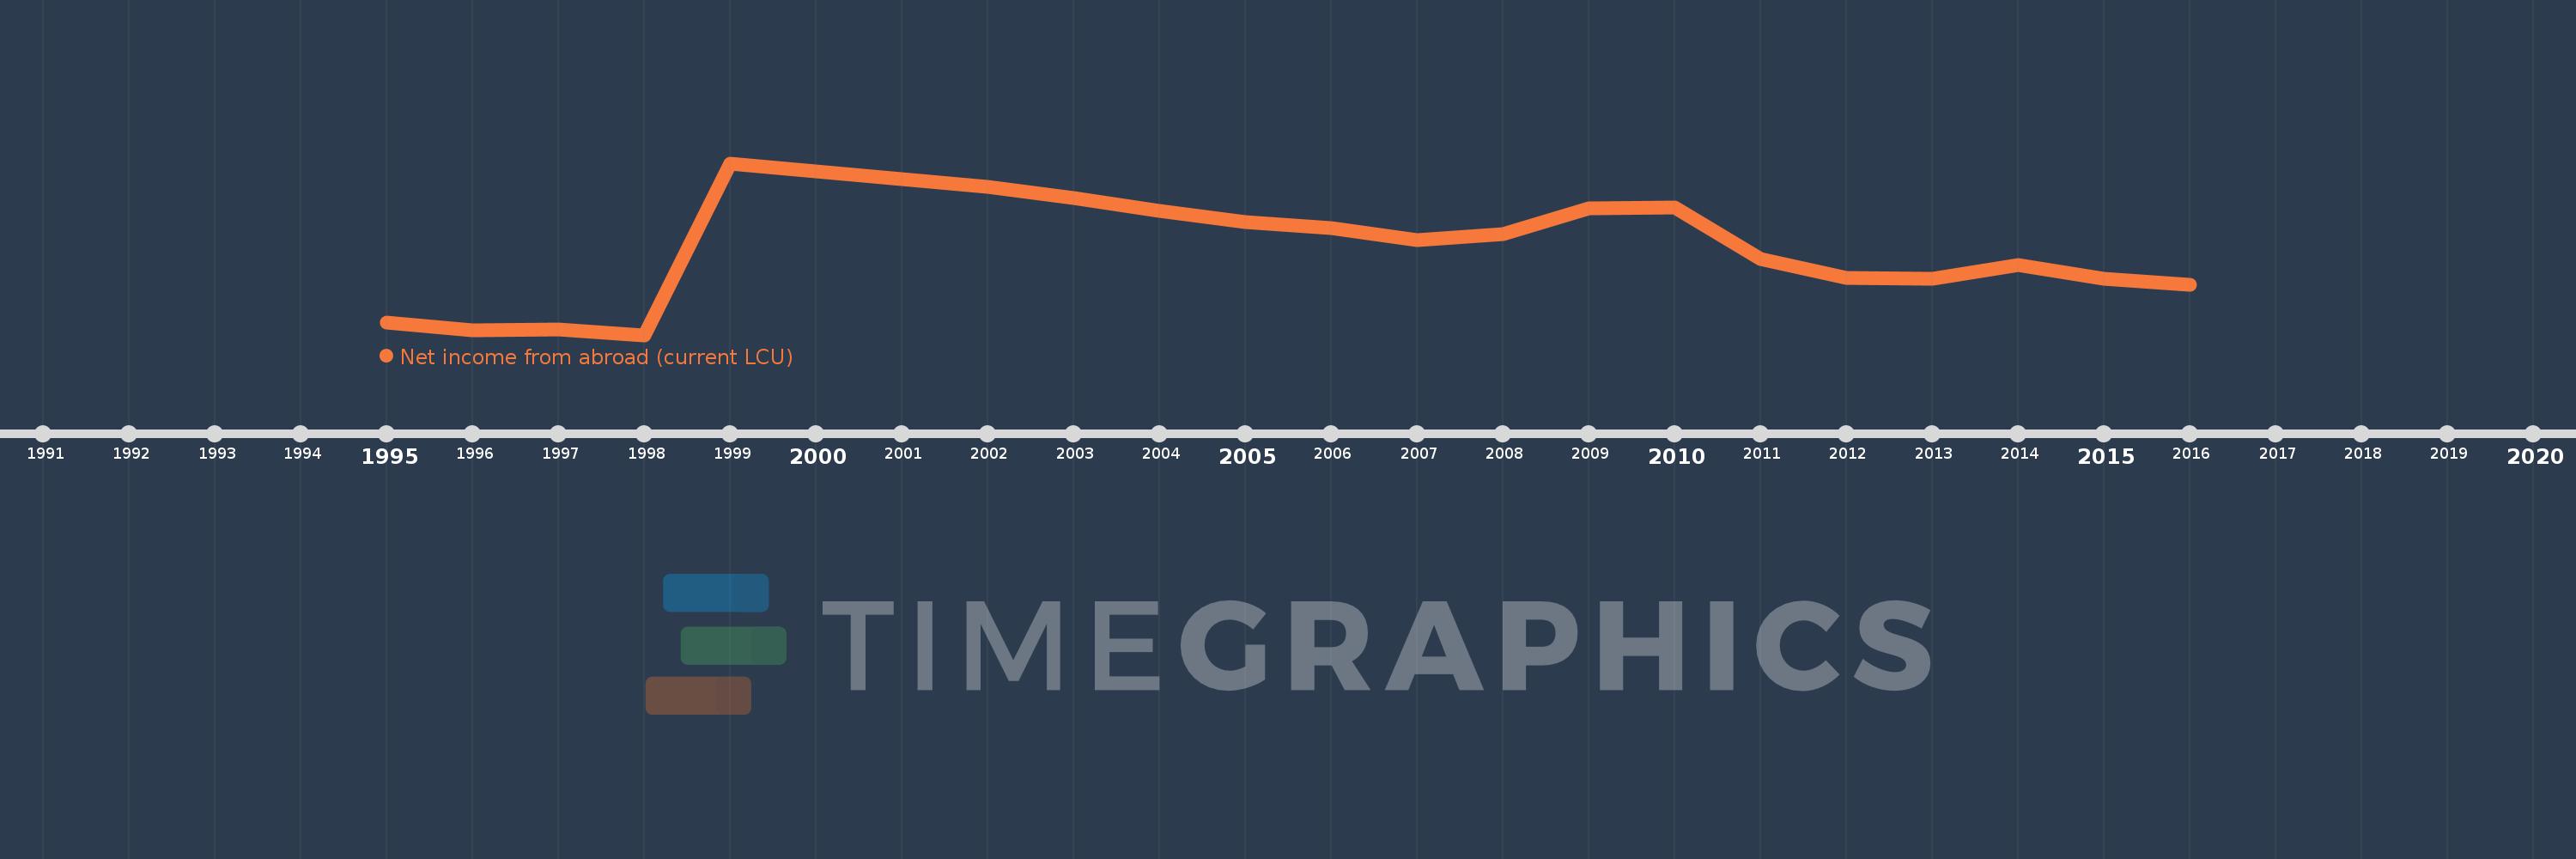
Cette échelle de temps montre un graphique de 1995 année à 2016 année Bosnia and Herzegovina. Les données jusqu'à 1994 année ne sont pas présentés. Quantité d'observations actuelles selon dates: 22.

Source (désignation):

Les indicateurs du développement mondiale

Source (organisation):

World Bank national accounts data, and OECD National Accounts data files.

Catégories:

Economy & Growth

Dernière mise à jour

23 avr. 2017

Les indicateurs de changement de valeurs selon les années

En moyenne:
547.887 mln.
Minimum:
-395.375 mln.
1 janv. 1998
Maximum:
1.424 mds
1 janv. 1999
Pour la date d''observation
Valeur
Changement absolu
Le changement par rapport à la valeur précédente
1 janv. 1995
-267.3 mln.
-267.3 mln.
0.0%
1 janv. 1996
-346.81 mln.
-79.51 mln.
29.75%
1 janv. 1997
-334.066 mln.
+12.745 mln.
-3.67%
1 janv. 1998
-395.375 mln.
-61.309 mln.
18.35%
1 janv. 1999
1.424 mds
+1.819 mds
-460.19%
1 janv. 2000
1.336 mds
-87.628 mln.
-6.15%
1 janv. 2001
1.252 mds
-84.12 mln.
-6.29%
1 janv. 2002
1.177 mds
-75.407 mln.
-6.02%
1 janv. 2003
1.057 mds
-119.757 mln.
-10.18%
1 janv. 2004
923.544 mln.
-133.638 mln.
-12.64%
1 janv. 2005
797.693 mln.
-125.851 mln.
-13.63%
1 janv. 2006
736.0 mln.
-61.693 mln.
-7.73%
1 janv. 2007
611.0 mln.
-125.0 mln.
-16.98%
1 janv. 2008
669.589 mln.
+58.589 mln.
9.59%
1 janv. 2009
942.924 mln.
+273.335 mln.
40.82%
1 janv. 2010
955.232 mln.
+12.308 mln.
1.31%
1 janv. 2011
412.549 mln.
-542.683 mln.
-56.81%
1 janv. 2012
210.524 mln.
-202.026 mln.
-48.97%
1 janv. 2013
203.966 mln.
-6.558 mln.
-3.12%
1 janv. 2014
349.573 mln.
+145.607 mln.
71.39%
1 janv. 2015
202.529 mln.
-147.044 mln.
-42.06%
1 janv. 2016
134.909 mln.
-67.621 mln.
-33.39%

Classement des pays selon les statistiques actuelles par années