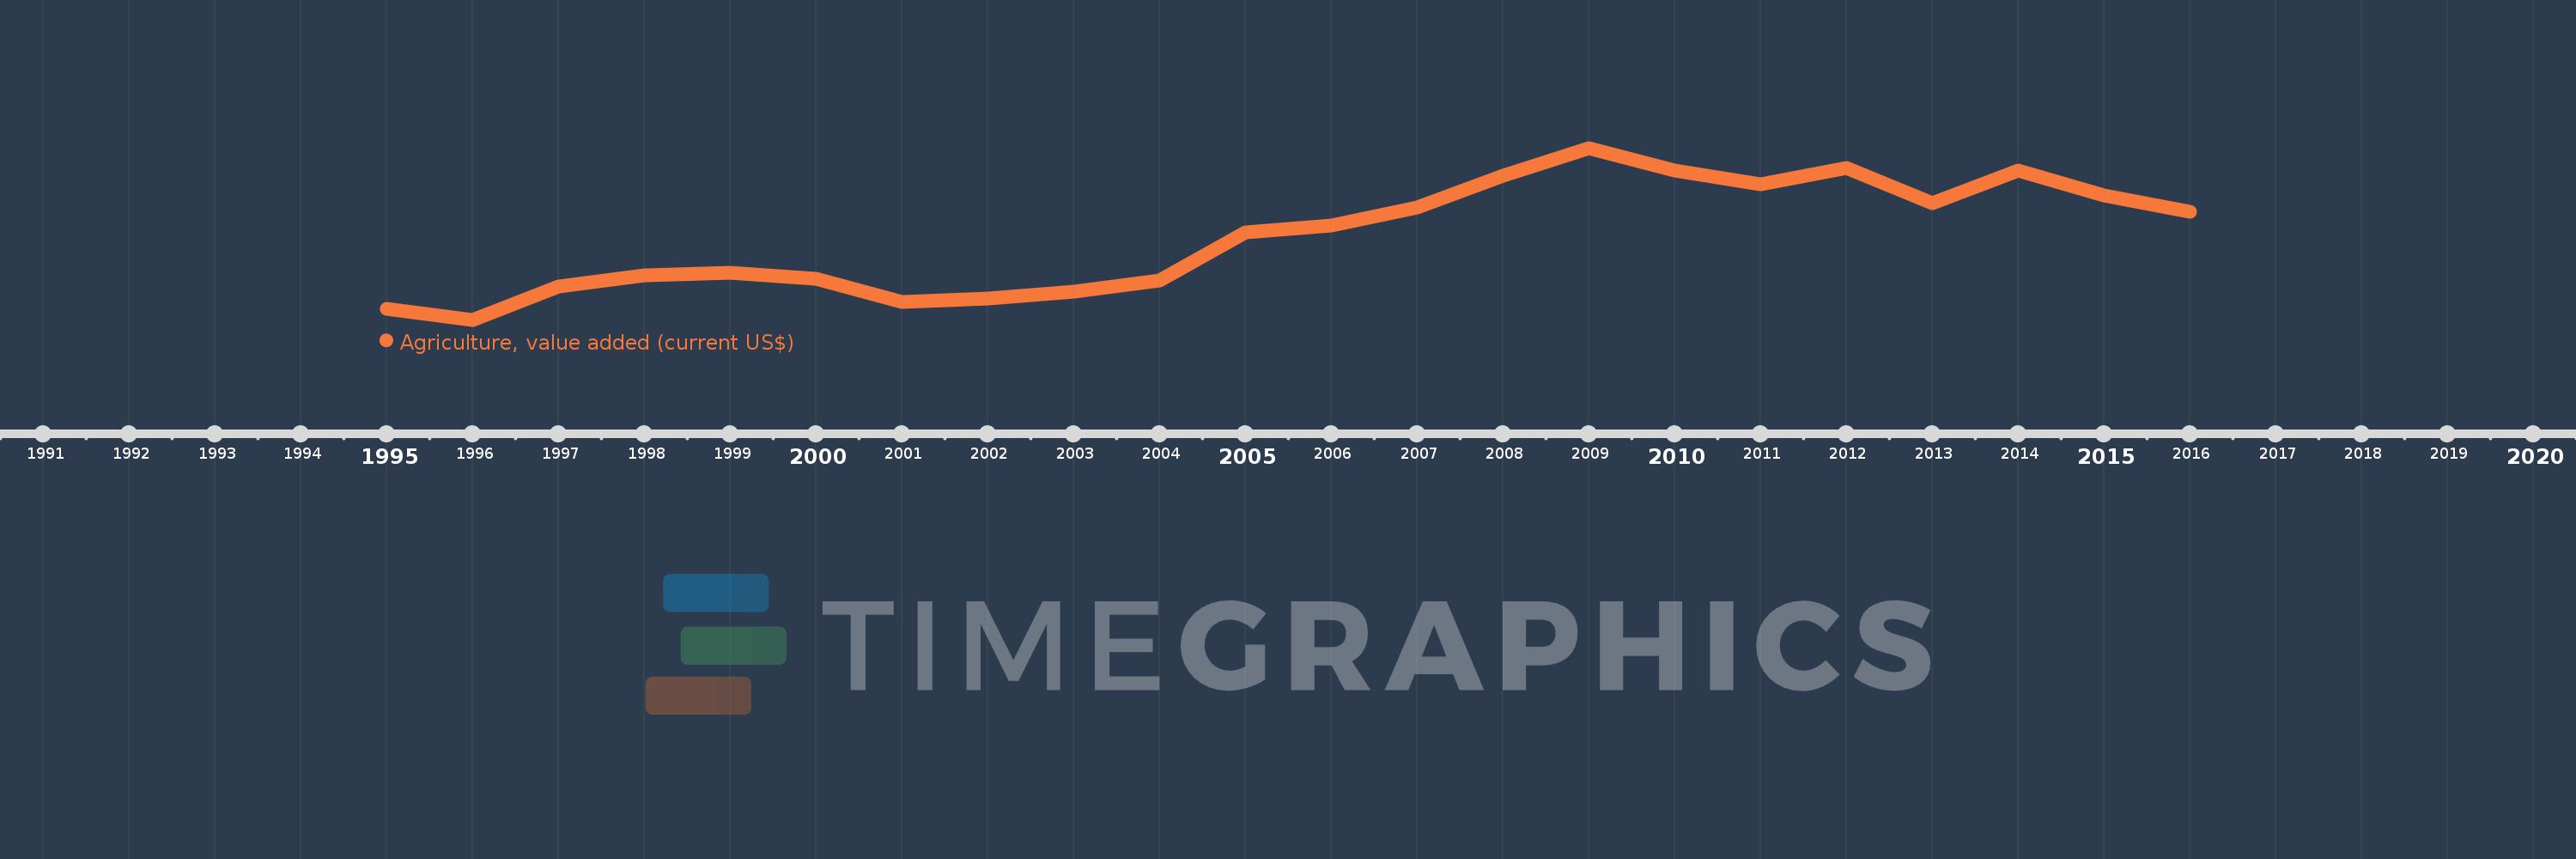
Cette échelle de temps montre un graphique de 1995 année à 2016 année Bosnia and Herzegovina. Les données jusqu'à 1994 année ne sont pas présentés. Quantité d'observations actuelles selon dates: 22.
Source (désignation):
Les indicateurs du développement mondiale
Source (organisation):
World Bank national accounts data, and OECD National Accounts data files.
Catégories:
Agriculture & Rural Development, Economy & Growth
Dernière mise à jour
23 avr. 2017
Les indicateurs de changement de valeurs selon les années
En moyenne:
864.848 mln.
Minimum:
386.381 mln.
1 janv. 1996
Maximum:
1.376 mds
1 janv. 2009
Pour la date d''observation
Valeur
Changement absolu
Le changement par rapport à la valeur précédente
1 janv. 1995
450.247 mln.
+450.247 mln.
0.0%
1 janv. 1996
386.381 mln.
-63.866 mln.
-14.18%
1 janv. 1997
576.711 mln.
+190.331 mln.
49.26%
1 janv. 1998
643.23 mln.
+66.519 mln.
11.53%
1 janv. 1999
657.042 mln.
+13.812 mln.
2.15%
1 janv. 2000
621.468 mln.
-35.574 mln.
-5.41%
1 janv. 2001
490.223 mln.
-131.246 mln.
-21.12%
1 janv. 2002
509.801 mln.
+19.578 mln.
3.99%
1 janv. 2003
550.332 mln.
+40.531 mln.
7.95%
1 janv. 2004
614.46 mln.
+64.128 mln.
11.65%
1 janv. 2005
887.378 mln.
+272.919 mln.
44.42%
1 janv. 2006
930.21 mln.
+42.831 mln.
4.83%
1 janv. 2007
1.035 mds
+105.1 mln.
11.3%
1 janv. 2008
1.215 mds
+179.309 mln.
17.32%
1 janv. 2009
1.376 mds
+161.555 mln.
13.3%
1 janv. 2010
1.245 mds
-131.062 mln.
-9.52%
1 janv. 2011
1.166 mds
-79.398 mln.
-6.38%
1 janv. 2012
1.259 mds
+93.09 mln.
7.99%
1 janv. 2013
1.057 mds
-202.054 mln.
-16.05%
1 janv. 2014
1.244 mds
+186.811 mln.
17.68%
1 janv. 2015
1.104 mds
-139.849 mln.
-11.25%
1 janv. 2016
1.009 mds
-94.29 mln.
-8.54%
Classement des pays selon les statistiques actuelles par années