33
/fr/
AIzaSyB4mHJ5NPEv-XzF7P6NDYXjlkCWaeKw5bc
November 30, 2025
85417
Bermuda
BMU
true
2
1
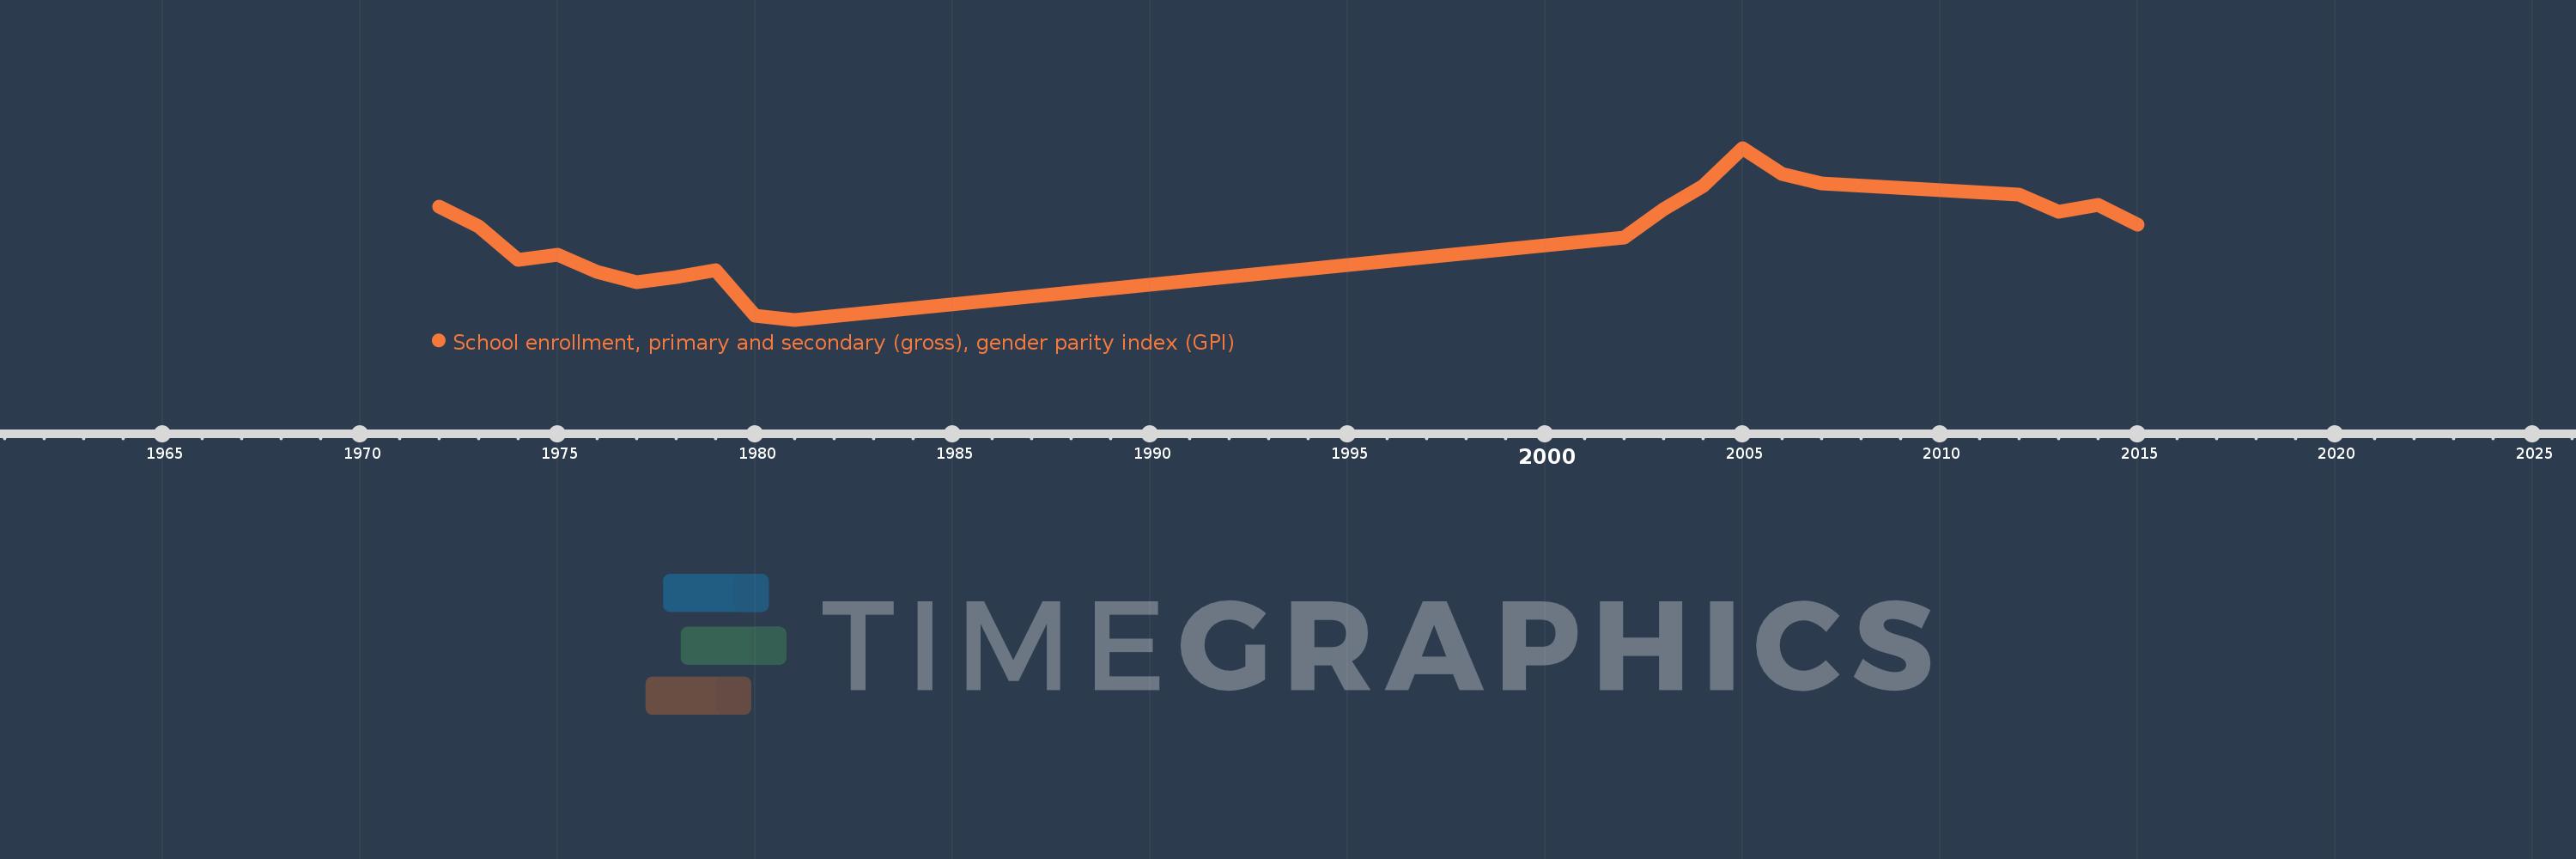
School enrollment, primary and secondary (gross), gender parity index (GPI)
2015,2014,2013,2012,2007,2006,2005,2004,2003,2002,1981,1980,1979,1978,1977,1976,1975,1974,1973,1972