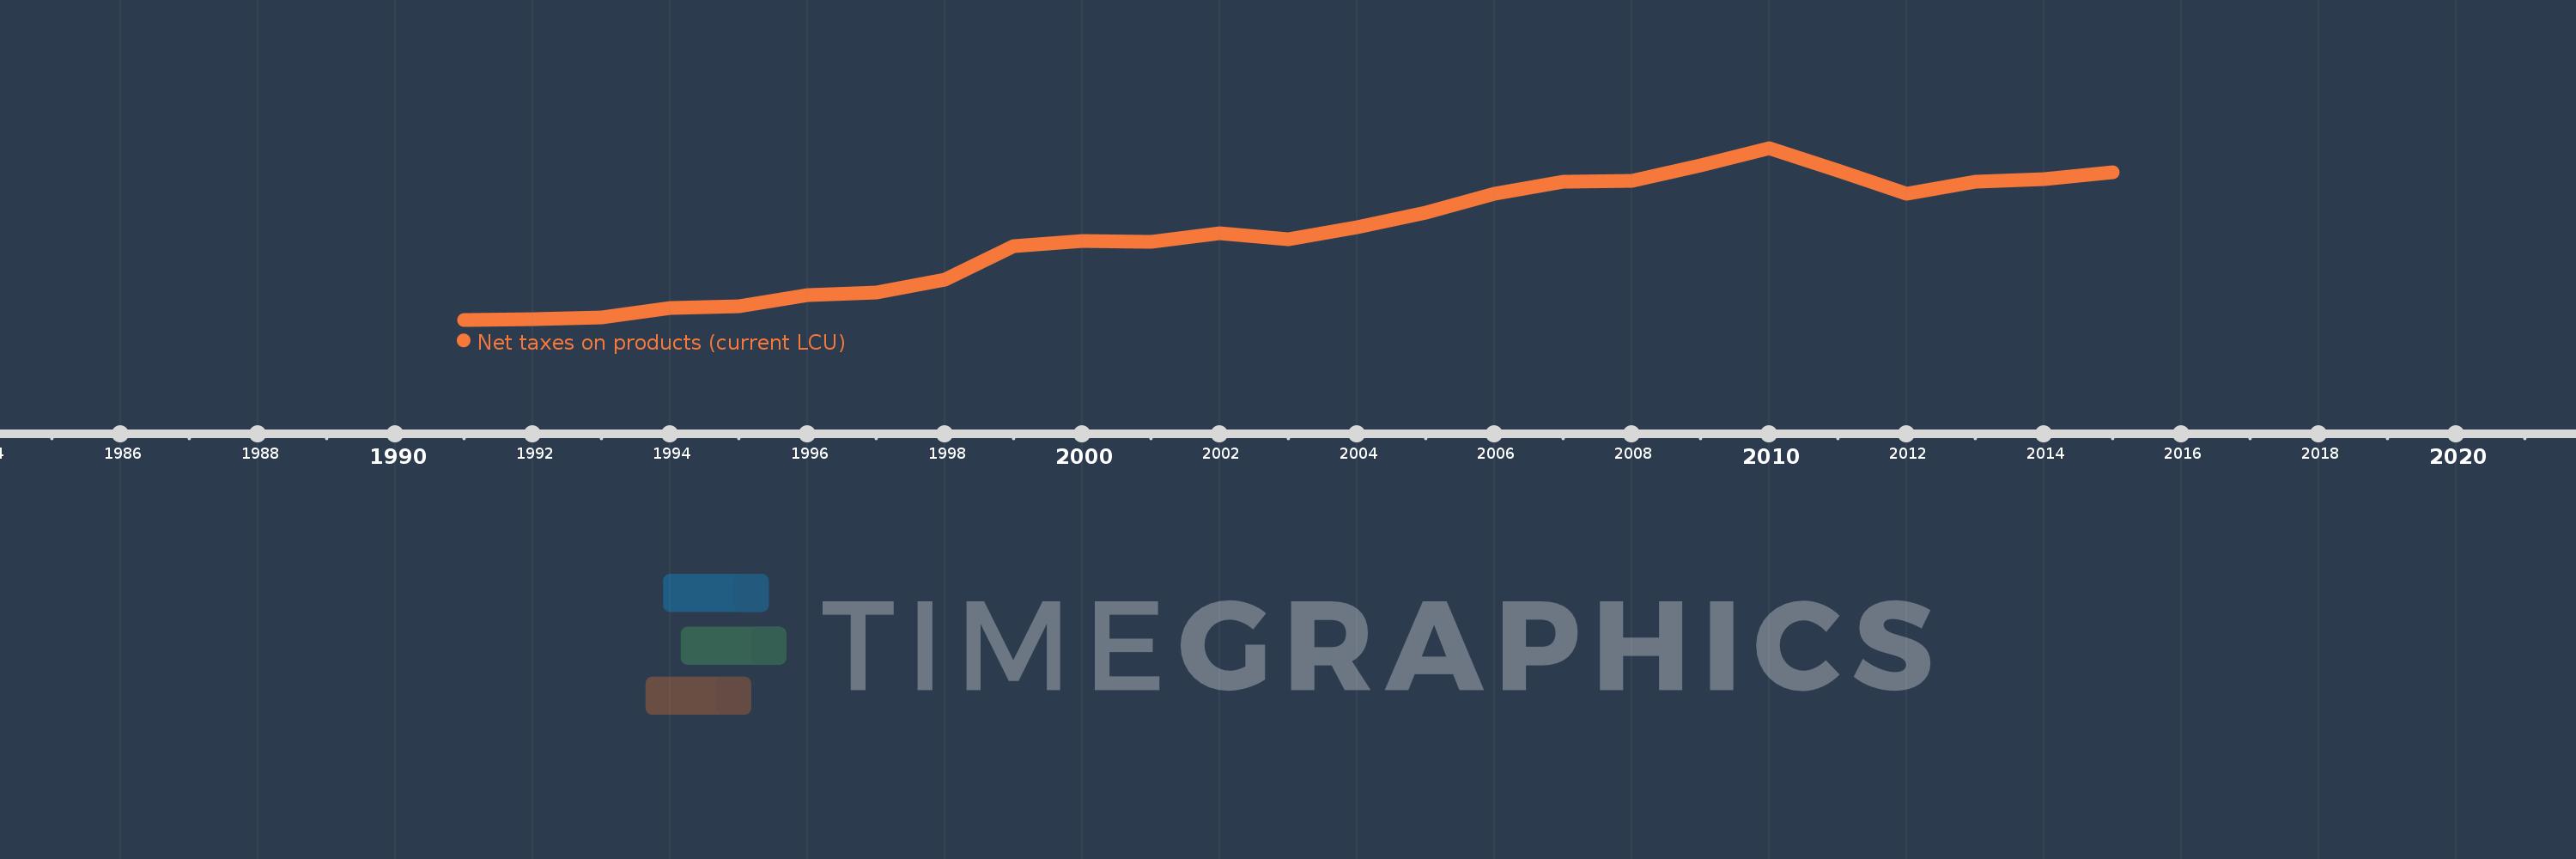
Cette échelle de temps montre un graphique de 1991 année à 2015 année Barbados. Les données jusqu'à 1990 année ne sont pas présentés. Quantité d'observations actuelles selon dates: 25.
Source (désignation):
Les indicateurs du développement mondiale
Source (organisation):
World Bank national accounts data, and OECD National Accounts data files.
Catégories:
Economy & Growth
Dernière mise à jour
23 avr. 2017
Les indicateurs de changement de valeurs selon les années
En moyenne:
982.072 mln.
Minimum:
431.5 mln.
1 janv. 1991
Maximum:
1.534 mds
1 janv. 2010
Pour la date d''observation
Valeur
Changement absolu
Le changement par rapport à la valeur précédente
1 janv. 1991
431.5 mln.
+431.5 mln.
0.0%
1 janv. 1992
434.0 mln.
+2.5 mln.
0.58%
1 janv. 1993
444.0 mln.
+10.0 mln.
2.3%
1 janv. 1994
507.0 mln.
+63.0 mln.
14.19%
1 janv. 1995
515.4 mln.
+8.4 mln.
1.66%
1 janv. 1996
587.8 mln.
+72.4 mln.
14.05%
1 janv. 1997
603.6 mln.
+15.8 mln.
2.69%
1 janv. 1998
689.3 mln.
+85.7 mln.
14.2%
1 janv. 1999
901.8 mln.
+212.5 mln.
30.83%
1 janv. 2000
935.1 mln.
+33.3 mln.
3.69%
1 janv. 2001
933.1 mln.
-2.0 mln.
-0.21%
1 janv. 2002
986.9 mln.
+53.8 mln.
5.77%
1 janv. 2003
949.6 mln.
-37.3 mln.
-3.78%
1 janv. 2004
1.027 mds
+77.0 mln.
8.11%
1 janv. 2005
1.12 mds
+93.4 mln.
9.1%
1 janv. 2006
1.241 mds
+121.2 mln.
10.82%
1 janv. 2007
1.317 mds
+75.6 mln.
6.09%
1 janv. 2008
1.321 mds
+4.1 mln.
0.31%
1 janv. 2009
1.42 mds
+99.3 mln.
7.52%
1 janv. 2010
1.534 mds
+113.3 mln.
7.98%
1 janv. 2011
1.389 mds
-144.8 mln.
-9.44%
1 janv. 2012
1.242 mds
-147.1 mln.
-10.59%
1 janv. 2013
1.315 mds
+73.5 mln.
5.92%
1 janv. 2014
1.332 mds
+16.9 mln.
1.29%
1 janv. 2015
1.376 mds
+44.1 mln.
3.31%
Classement des pays selon les statistiques actuelles par années