29
/fr/
fr
AIzaSyAYiBZKx7MnpbEhh9jyipgxe19OcubqV5w
April 1, 2024
79755
Barbados
BRB
true
2
1
Net enrolment rate, secondary, both sexes (%)
2015,2012,2011,2010,2009,2008,2007,2006,2005,2004,2003,2002,2001,2000,1991,1990,1986,1985,1984,1983,1982,1979
Download
Bibliothèque de statistiques globales →Barbados →

Net enrolment rate, secondary, both sexes (%)

Cette statistique dans les autres pays:
AfghanistanAlbaniaAlgeriaAngolaAntigua and BarbudaArab WorldArgentinaArmeniaArubaAustraliaAustriaAzerbaijanBahamas, TheBahrainBangladeshBarbadosBelarusBelgiumBelizeBeninBermudaBhutanBoliviaBotswanaBrazilBritish Virgin IslandsBrunei DarussalamBulgariaBurkina FasoBurundiCabo VerdeCambodiaCameroonCanadaCaribbean small statesCentral African RepublicCentral Europe and the BalticsChadChileColombiaComorosCongo, Dem. Rep.Congo, Rep.Costa RicaCroatiaCubaCyprusDenmarkDjiboutiDominicaDominican RepublicEarly-demographic dividendEast Asia & PacificEast Asia & Pacific (excluding high income)East Asia & Pacific (IDA & IBRD countries)EcuadorEgypt, Arab Rep.El SalvadorEquatorial GuineaEritreaEstoniaEthiopiaEuro areaEurope & Central AsiaEurope & Central Asia (excluding high income)Europe & Central Asia (IDA & IBRD countries)European UnionFijiFinlandFragile and conflict affected situationsFranceGambia, TheGeorgiaGhanaGreeceGrenadaGuatemalaGuineaGuinea-BissauGuyanaHeavily indebted poor countries (HIPC)High incomeHondurasHong Kong SAR, ChinaHungaryIBRD onlyIcelandIDA & IBRD totalIDA blendIDA onlyIDA totalIndiaIndonesiaIran, Islamic Rep.IraqIrelandIsraelItalyJamaicaJapanJordanKazakhstanKenyaKiribatiKorea, Dem. People’s Rep.Korea, Rep.KuwaitKyrgyz RepublicLao PDRLate-demographic dividendLatin America & Caribbean Latin America & Caribbean (excluding high income)Latin America & the Caribbean (IDA & IBRD countries)LatviaLeast developed countries: UN classificationLebanonLesothoLibyaLiechtensteinLithuaniaLow & middle incomeLow incomeLower middle incomeLuxembourgMacao SAR, ChinaMacedonia, FYRMadagascarMalawiMalaysiaMaldivesMaliMaltaMarshall IslandsMauritaniaMauritiusMexicoMiddle East & North AfricaMiddle East & North Africa (excluding high income)Middle East & North Africa (IDA & IBRD countries)Middle incomeMoldovaMongoliaMoroccoMozambiqueMyanmarNamibiaNauruNepalNetherlandsNew ZealandNicaraguaNigerNorth AmericaNorwayOECD membersOmanOther small statesPacific island small statesPakistanPanamaParaguayPeruPhilippinesPolandPortugalPost-demographic dividendPre-demographic dividendPuerto RicoQatarRomaniaSamoaSao Tome and PrincipeSaudi ArabiaSenegalSerbiaSeychellesSierra LeoneSloveniaSmall statesSolomon IslandsSomaliaSouth AfricaSouth AsiaSouth Asia (IDA & IBRD)SpainSri LankaSt. Kitts and NevisSt. LuciaSt. Vincent and the GrenadinesSub-Saharan Africa Sub-Saharan Africa (excluding high income)Sub-Saharan Africa (IDA & IBRD countries)SurinameSwazilandSwedenSwitzerlandSyrian Arab RepublicTajikistanThailandTimor-LesteTogoTongaTrinidad and TobagoTunisiaTurkeyTuvaluUgandaUkraineUnited Arab EmiratesUnited KingdomUnited StatesUpper middle incomeUruguayVanuatuVenezuela, RBVietnamWest Bank and GazaWorldYemen, Rep.Zimbabwe
La ligne de temps
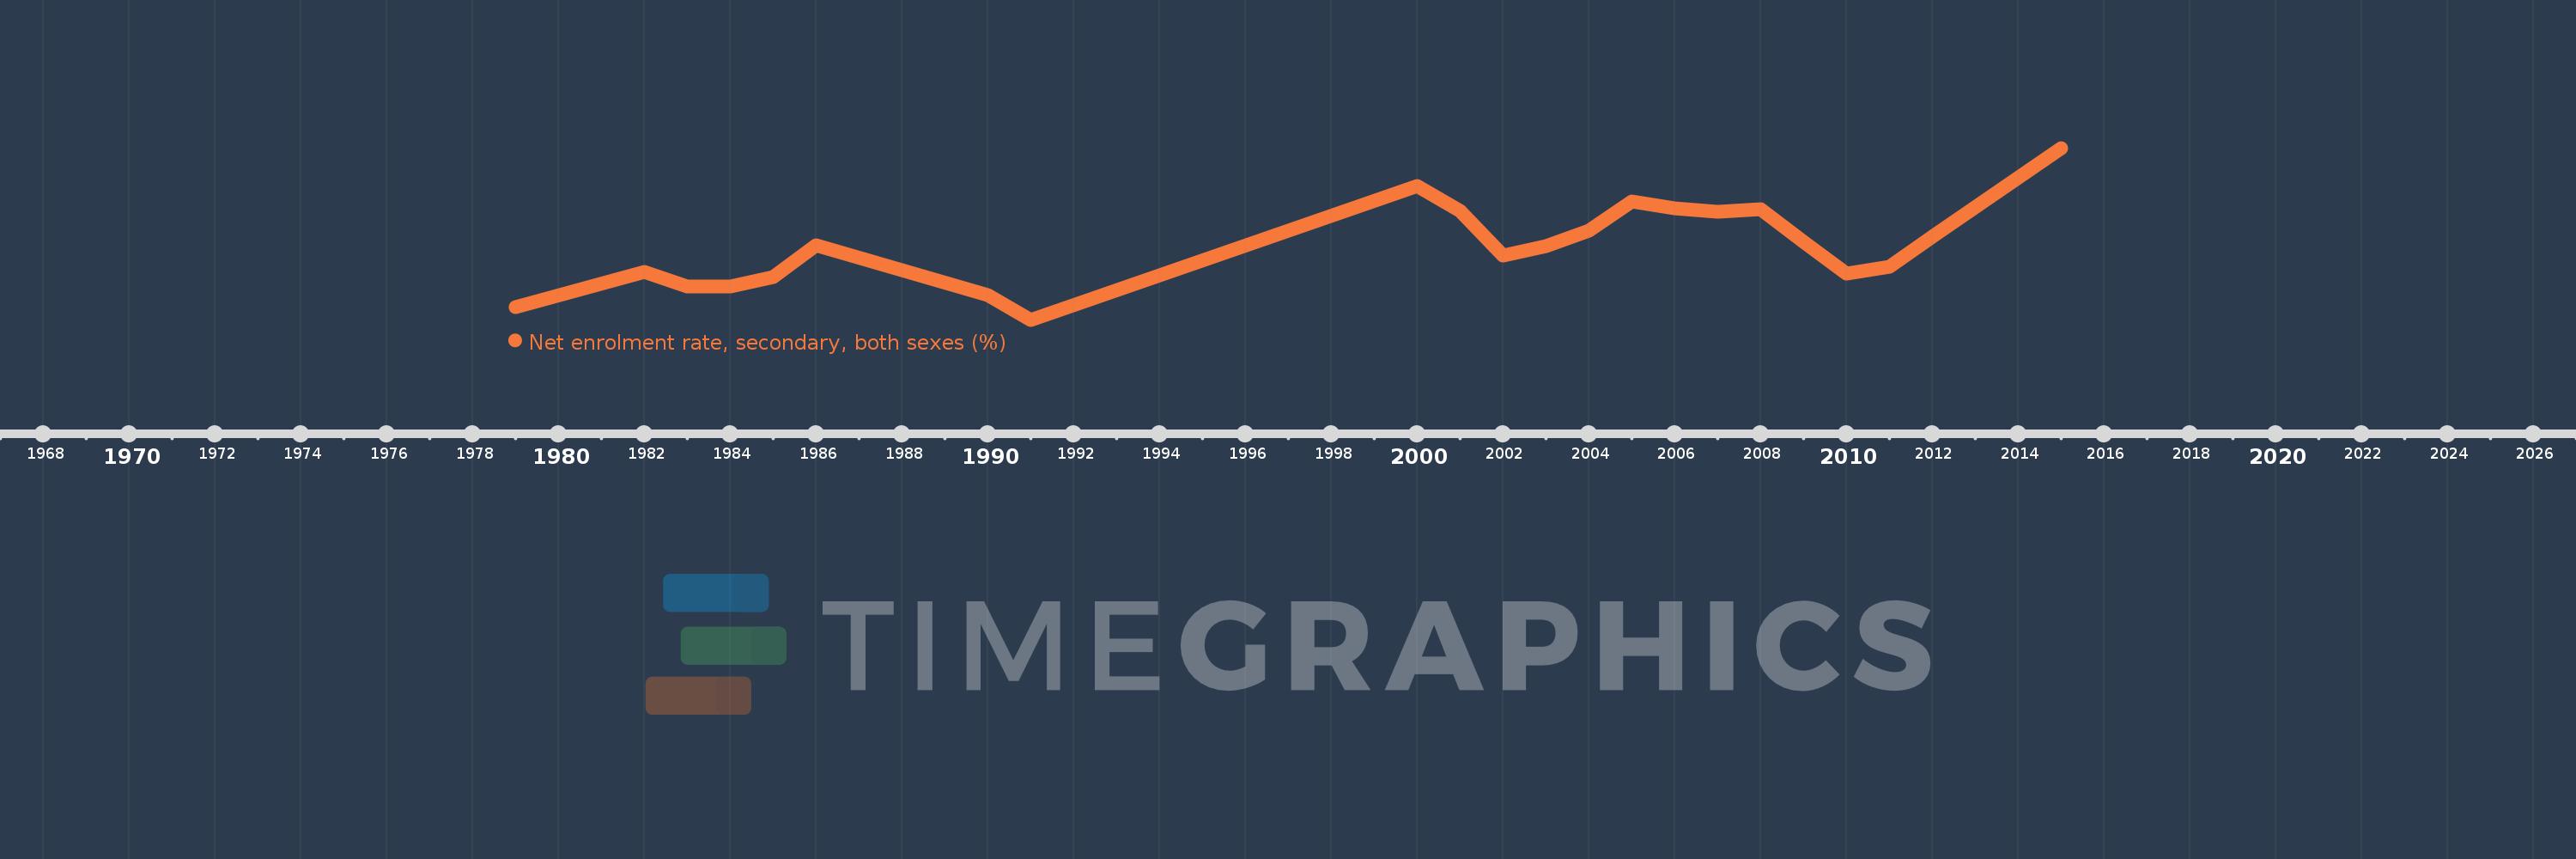
Cette échelle de temps montre un graphique de 1979 année à 2015 année Barbados. Les données jusqu'à 1978 année ne sont pas présentés. Quantité d'observations actuelles selon dates: 22.
Source (désignation):
Les indicateurs du développement mondiale
Source (organisation):
UNESCO Institute for Statistics
Catégories:
Education
Dernière mise à jour
23 avr. 2017
Les indicateurs de changement de valeurs selon les années
En moyenne:
87.678
Minimum:
78.881
1 janv. 1991
Maximum:
99.429
1 janv. 2015
Pour la date d''observation
Valeur
Changement absolu
Le changement par rapport à la valeur précédente
1 janv. 1979
80.434
+80.434
0.0%
1 janv. 1982
84.588
+4.154
5.16%
1 janv. 1983
82.895
-1.693
-2.0%
1 janv. 1984
82.893
-0.001
0.0%
1 janv. 1985
83.937
+1.044
1.26%
1 janv. 1986
87.785
+3.847
4.58%
1 janv. 1990
81.824
-5.96
-6.79%
1 janv. 1991
78.881
-2.943
-3.6%
1 janv. 2000
94.89
+16.009
20.3%
1 janv. 2001
91.894
-2.996
-3.16%
1 janv. 2002
86.521
-5.373
-5.85%
1 janv. 2003
87.652
+1.131
1.31%
1 janv. 2004
89.508
+1.856
2.12%
1 janv. 2005
93.07
+3.562
3.98%
1 janv. 2006
92.205
-0.865
-0.93%
1 janv. 2007
91.75
-0.456
-0.49%
1 janv. 2008
92.134
+0.384
0.42%
1 janv. 2009
88.233
-3.9
-4.23%
1 janv. 2010
84.398
-3.836
-4.35%
1 janv. 2011
85.183
+0.785
0.93%
1 janv. 2012
88.811
+3.628
4.26%
1 janv. 2015
99.429
+10.618
11.96%
Classement des pays selon les statistiques actuelles par années

Commentaires:

Envoyer
PremiumAbout & FeedbackUn accordConfidentialité
logo
© 2022 Selected Technologies LLC – Morgan Hill, California