33
/fr/
AIzaSyB4mHJ5NPEv-XzF7P6NDYXjlkCWaeKw5bc
November 30, 2025
77334
Bahrain
BHR
true
2
1
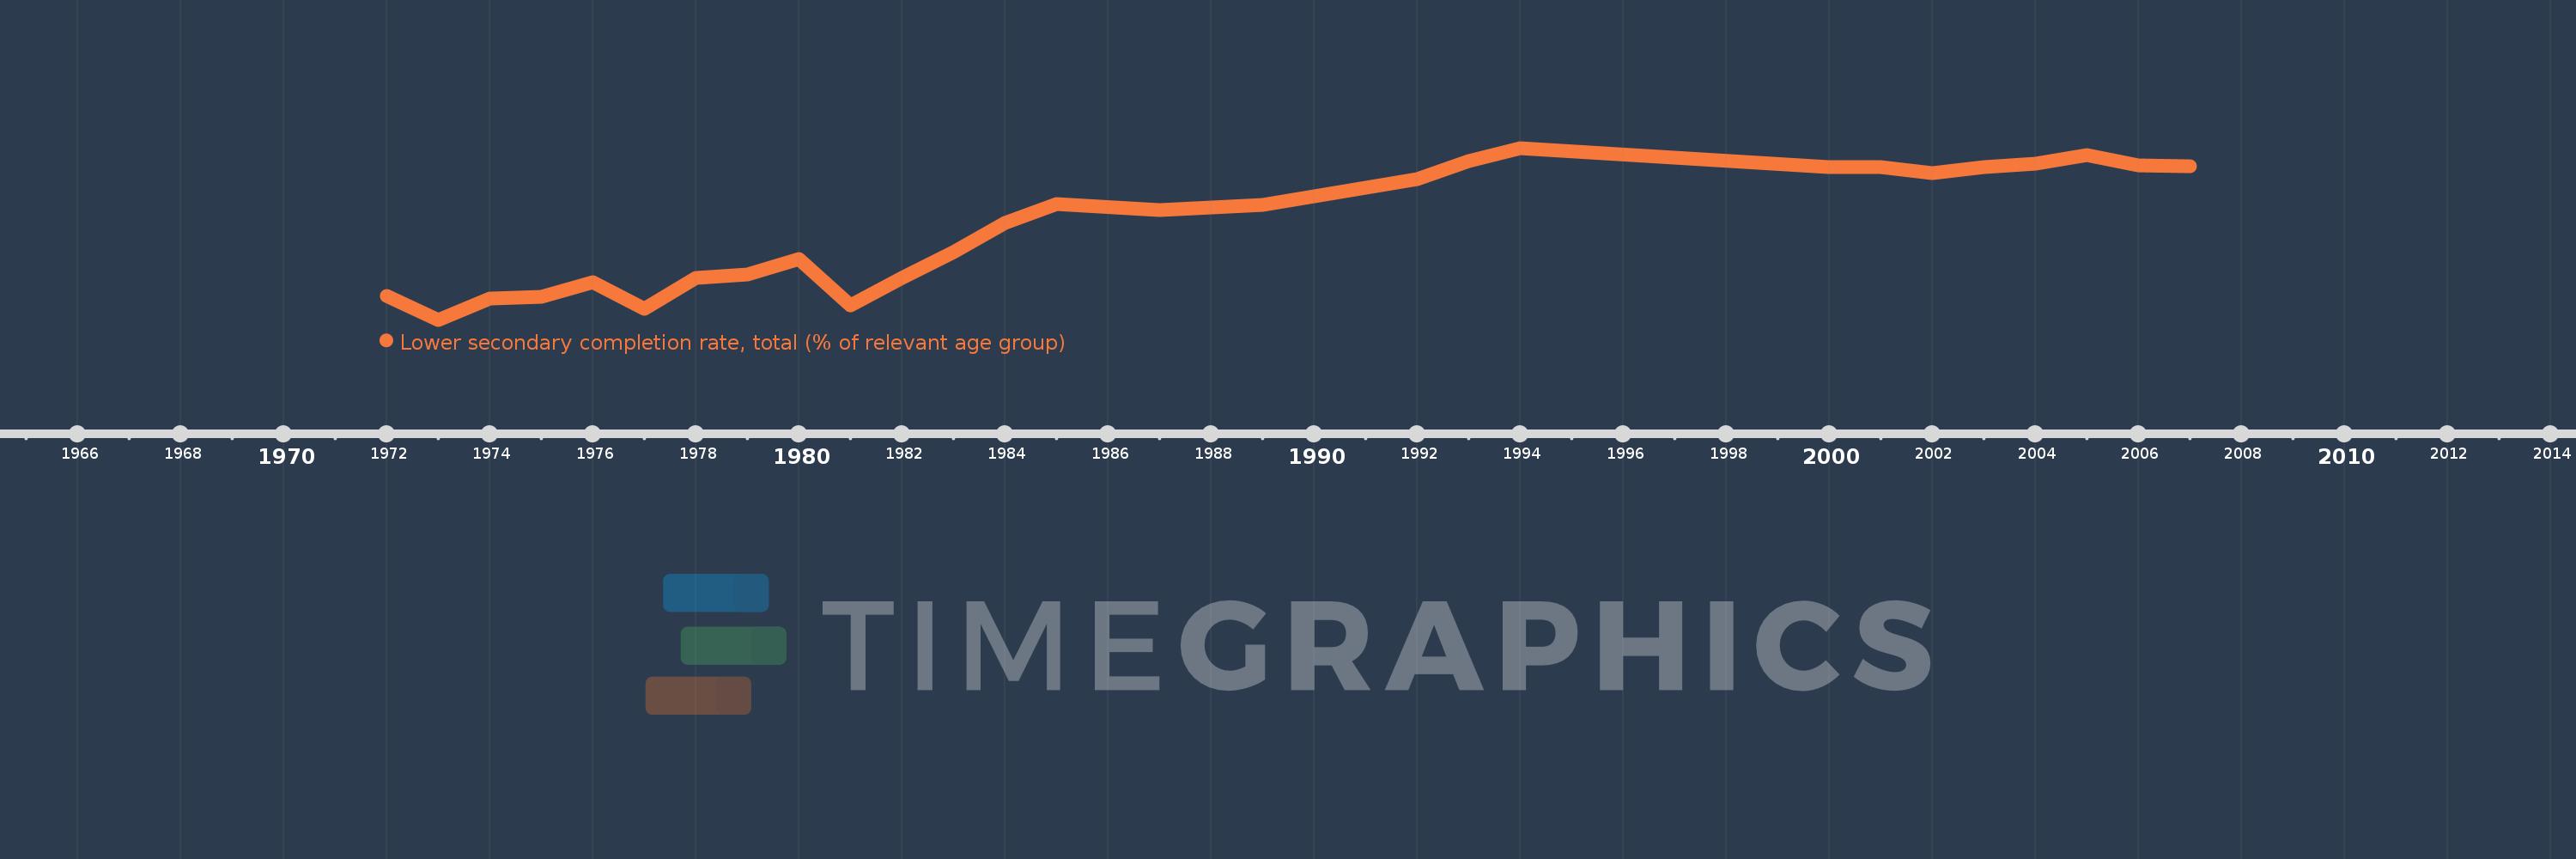
Lower secondary completion rate, total (% of relevant age group)
2007,2006,2005,2004,2003,2002,2001,2000,1994,1993,1992,1989,1987,1985,1984,1983,1982,1981,1980,1979,1978,1977,1976,1975,1974,1973,1972