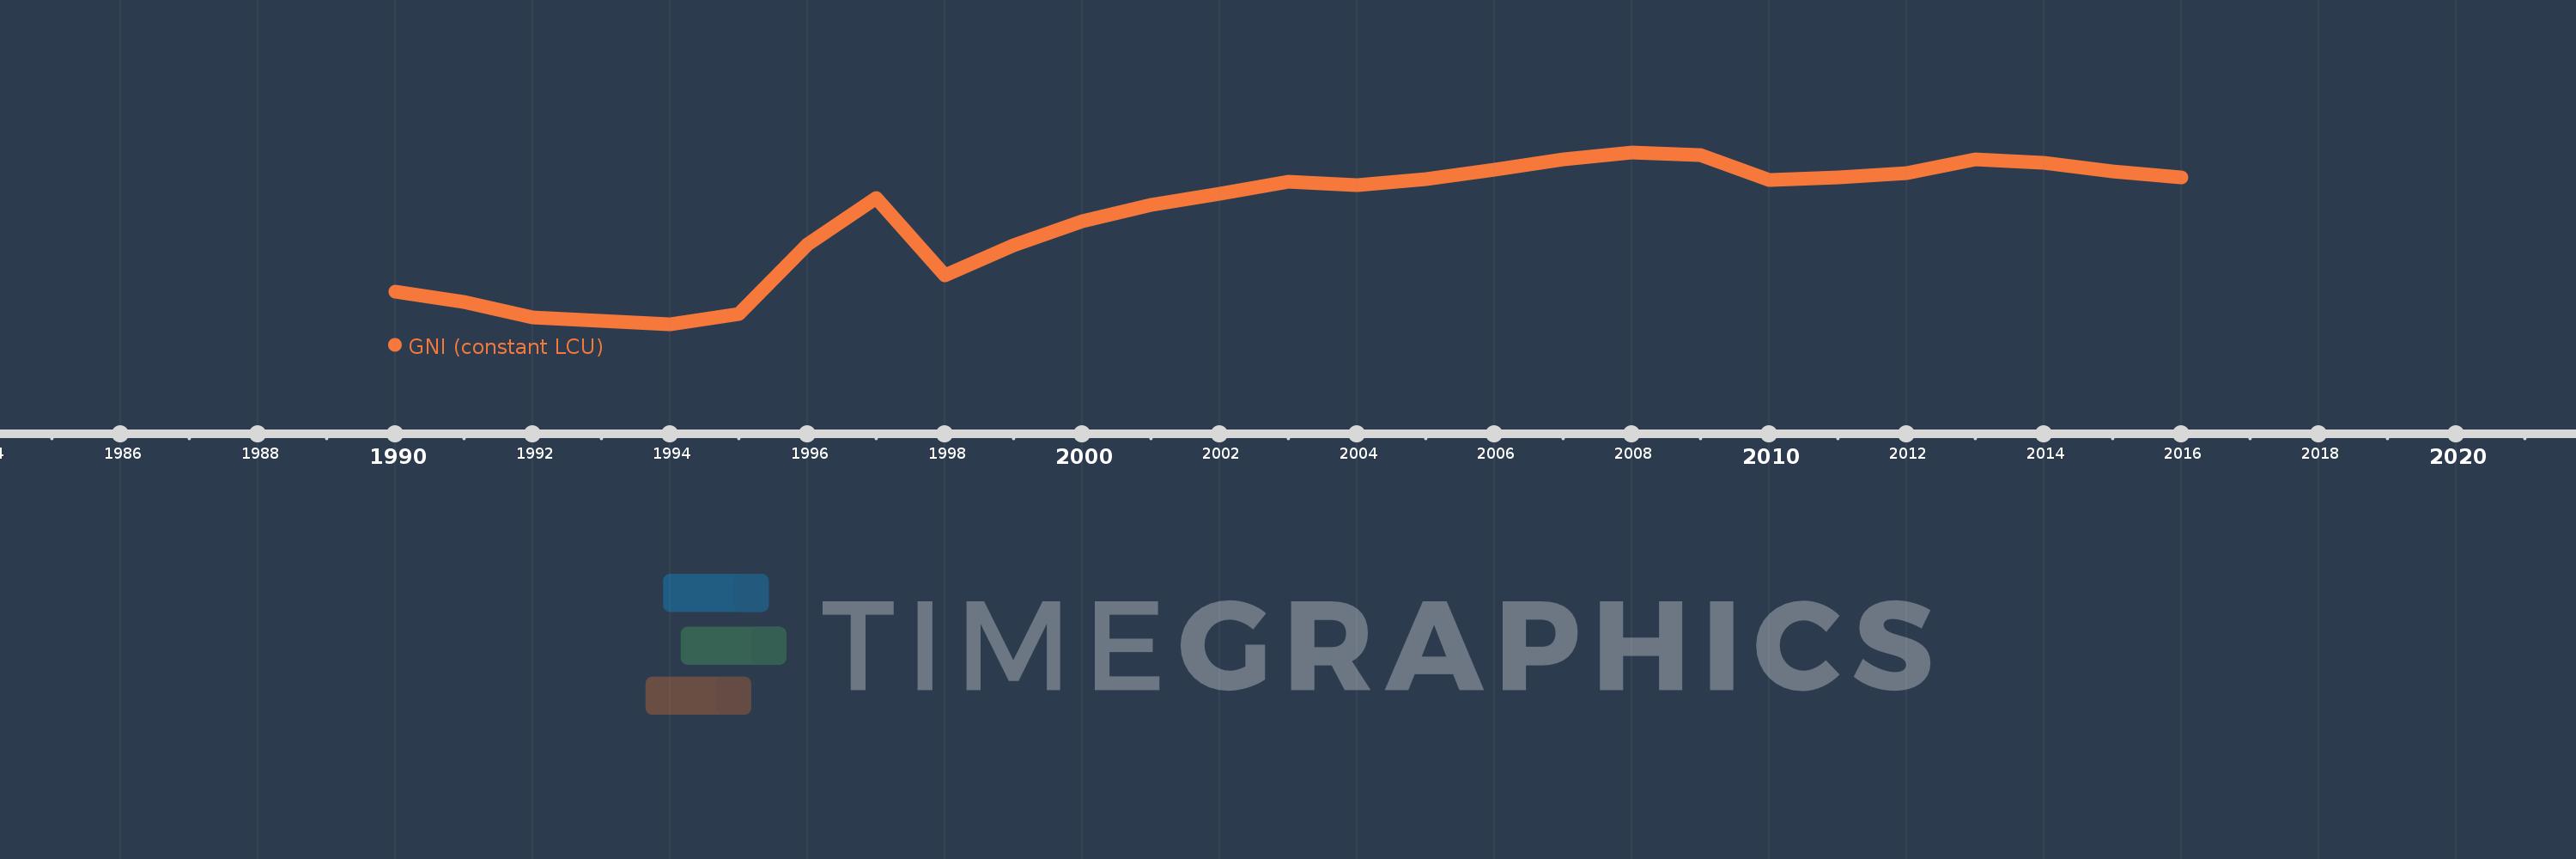
Cette échelle de temps montre un graphique de 1990 année à 2016 année Bahamas, The. Les données jusqu'à 1989 année ne sont pas présentés. Quantité d'observations actuelles selon dates: 27.
Source (désignation):
Les indicateurs du développement mondiale
Source (organisation):
World Bank national accounts data, and OECD National Accounts data files.
Catégories:
Economy & Growth
Dernière mise à jour
23 avr. 2017
Les indicateurs de changement de valeurs selon les années
En moyenne:
6.85 mds
Minimum:
5.156 mds
1 janv. 1994
Maximum:
7.852 mds
1 janv. 2008
Pour la date d''observation
Valeur
Changement absolu
Le changement par rapport à la valeur précédente
1 janv. 1990
5.66 mds
+5.66 mds
0.0%
1 janv. 1991
5.508 mds
-151.991 mln.
-2.69%
1 janv. 1992
5.267 mds
-241.101 mln.
-4.38%
1 janv. 1993
5.208 mds
-58.51 mln.
-1.11%
1 janv. 1994
5.156 mds
-52.579 mln.
-1.01%
1 janv. 1995
5.314 mds
+158.111 mln.
3.07%
1 janv. 1996
6.406 mds
+1.092 mds
20.56%
1 janv. 1997
7.13 mds
+724.235 mln.
11.31%
1 janv. 1998
5.921 mds
-1.21 mds
-16.97%
1 janv. 1999
6.388 mds
+467.192 mln.
7.89%
1 janv. 2000
6.766 mds
+378.132 mln.
5.92%
1 janv. 2001
7.027 mds
+260.604 mln.
3.85%
1 janv. 2002
7.202 mds
+175.241 mln.
2.49%
1 janv. 2003
7.39 mds
+188.294 mln.
2.61%
1 janv. 2004
7.342 mds
-48.139 mln.
-0.65%
1 janv. 2005
7.432 mds
+89.994 mln.
1.23%
1 janv. 2006
7.581 mds
+149.311 mln.
2.01%
1 janv. 2007
7.748 mds
+166.349 mln.
2.19%
1 janv. 2008
7.852 mds
+104.006 mln.
1.34%
1 janv. 2009
7.812 mds
-39.688 mln.
-0.51%
1 janv. 2010
7.423 mds
-388.443 mln.
-4.97%
1 janv. 2011
7.466 mds
+42.391 mln.
0.57%
1 janv. 2012
7.528 mds
+61.977 mln.
0.83%
1 janv. 2013
7.736 mds
+208.389 mln.
2.77%
1 janv. 2014
7.687 mds
-48.895 mln.
-0.63%
1 janv. 2015
7.555 mds
-132.501 mln.
-1.72%
1 janv. 2016
7.458 mds
-96.998 mln.
-1.28%
Classement des pays selon les statistiques actuelles par années