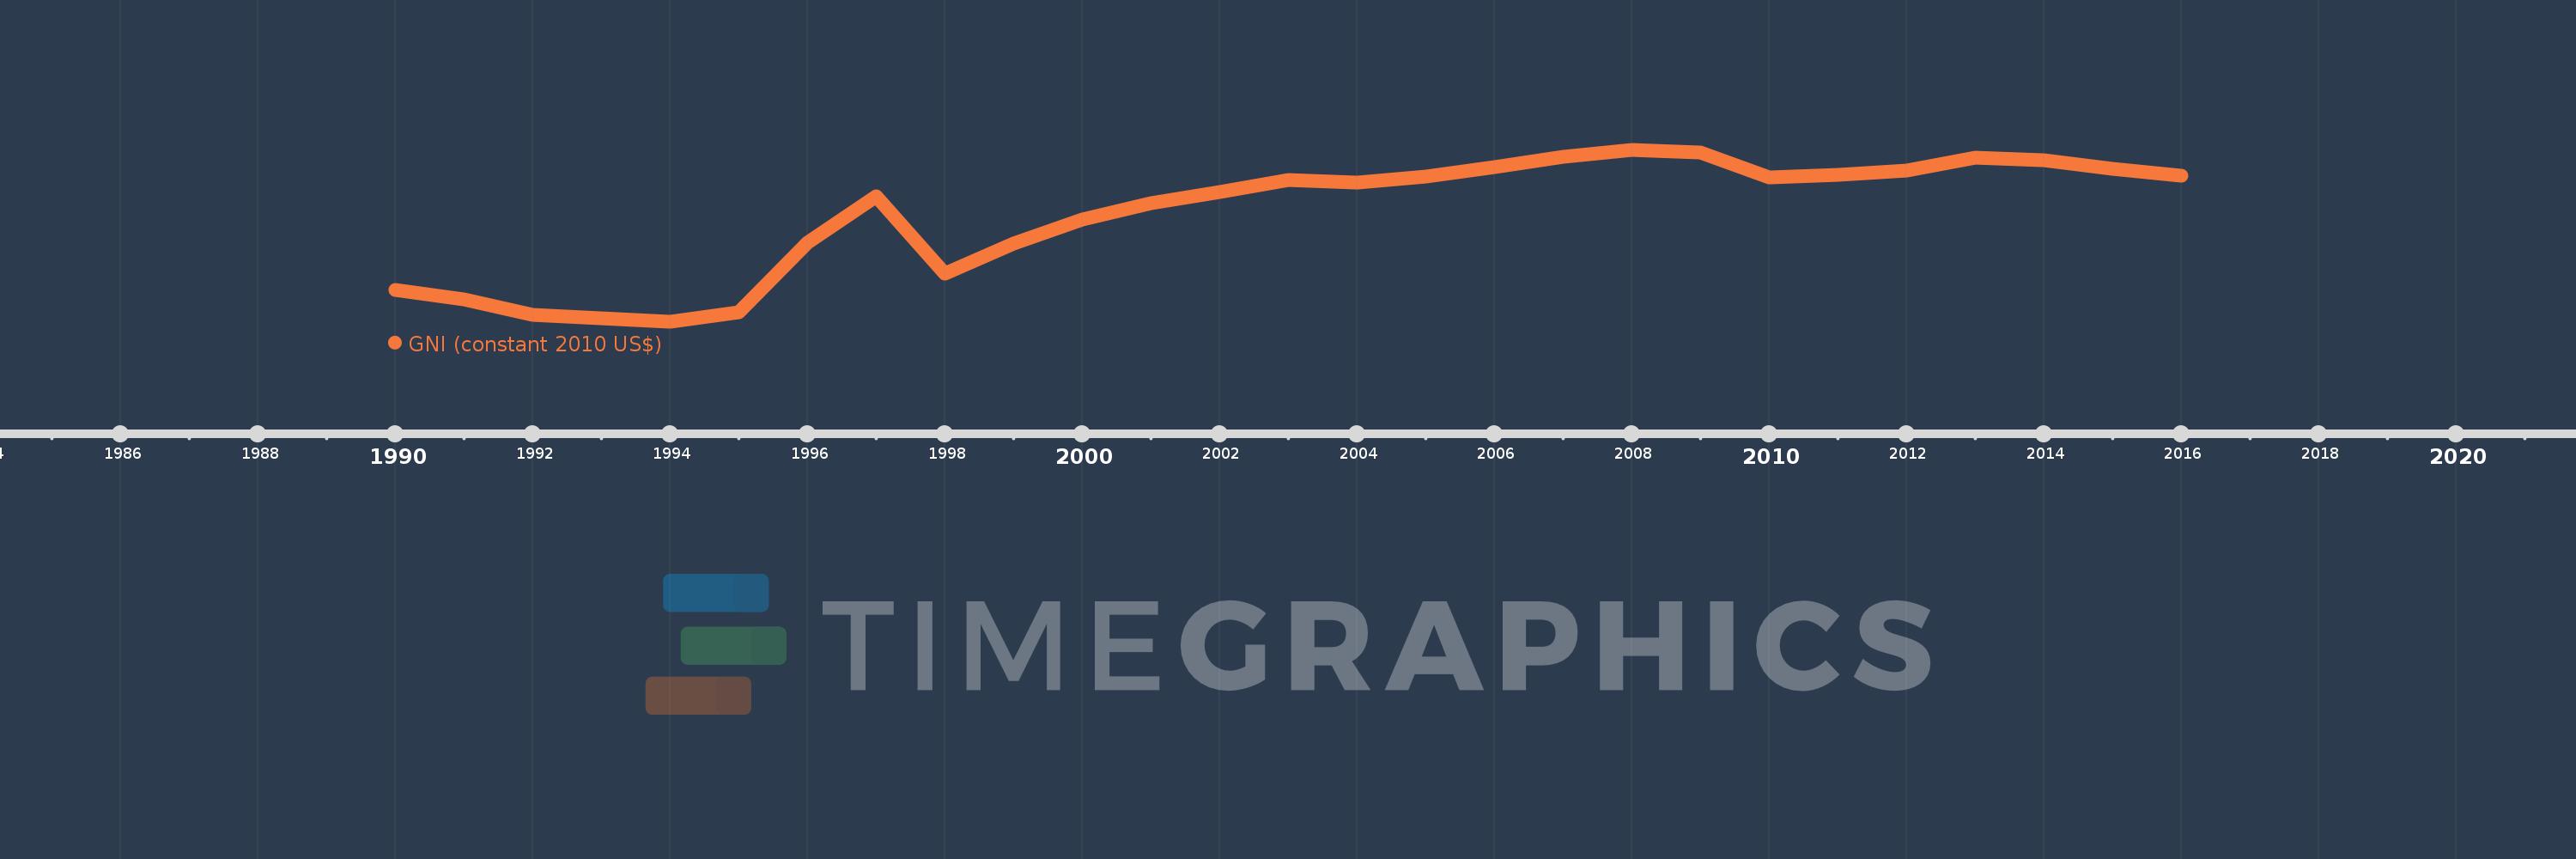
Cette échelle de temps montre un graphique de 1990 année à 2016 année Bahamas, The. Les données jusqu'à 1989 année ne sont pas présentés. Quantité d'observations actuelles selon dates: 27.
Source (désignation):
Les indicateurs du développement mondiale
Source (organisation):
World Bank national accounts data, and OECD National Accounts data files.
Catégories:
Economy & Growth
Dernière mise à jour
23 avr. 2017
Les indicateurs de changement de valeurs selon les années
En moyenne:
7.042 mds
Minimum:
5.3 mds
1 janv. 1994
Maximum:
8.071 mds
1 janv. 2008
Pour la date d''observation
Valeur
Changement absolu
Le changement par rapport à la valeur précédente
1 janv. 1990
5.818 mds
+5.818 mds
0.0%
1 janv. 1991
5.662 mds
-156.242 mln.
-2.69%
1 janv. 1992
5.414 mds
-247.845 mln.
-4.38%
1 janv. 1993
5.354 mds
-60.147 mln.
-1.11%
1 janv. 1994
5.3 mds
-54.05 mln.
-1.01%
1 janv. 1995
5.462 mds
+162.534 mln.
3.07%
1 janv. 1996
6.585 mds
+1.123 mds
20.56%
1 janv. 1997
7.33 mds
+744.494 mln.
11.31%
1 janv. 1998
6.086 mds
-1.244 mds
-16.97%
1 janv. 1999
6.566 mds
+480.26 mln.
7.89%
1 janv. 2000
6.955 mds
+388.709 mln.
5.92%
1 janv. 2001
7.223 mds
+267.894 mln.
3.85%
1 janv. 2002
7.403 mds
+180.143 mln.
2.49%
1 janv. 2003
7.597 mds
+193.561 mln.
2.61%
1 janv. 2004
7.547 mds
-49.486 mln.
-0.65%
1 janv. 2005
7.64 mds
+92.511 mln.
1.23%
1 janv. 2006
7.793 mds
+153.487 mln.
2.01%
1 janv. 2007
7.964 mds
+171.002 mln.
2.19%
1 janv. 2008
8.071 mds
+106.916 mln.
1.34%
1 janv. 2009
8.03 mds
-40.799 mln.
-0.51%
1 janv. 2010
7.631 mds
-399.308 mln.
-4.97%
1 janv. 2011
7.675 mds
+43.577 mln.
0.57%
1 janv. 2012
7.738 mds
+63.71 mln.
0.83%
1 janv. 2013
7.953 mds
+214.218 mln.
2.77%
1 janv. 2014
7.902 mds
-50.263 mln.
-0.63%
1 janv. 2015
7.766 mds
-136.208 mln.
-1.72%
1 janv. 2016
7.666 mds
-99.711 mln.
-1.28%
Classement des pays selon les statistiques actuelles par années