33
/fr/
AIzaSyB4mHJ5NPEv-XzF7P6NDYXjlkCWaeKw5bc
November 30, 2025
68175
Angola
AGO
true
2
1
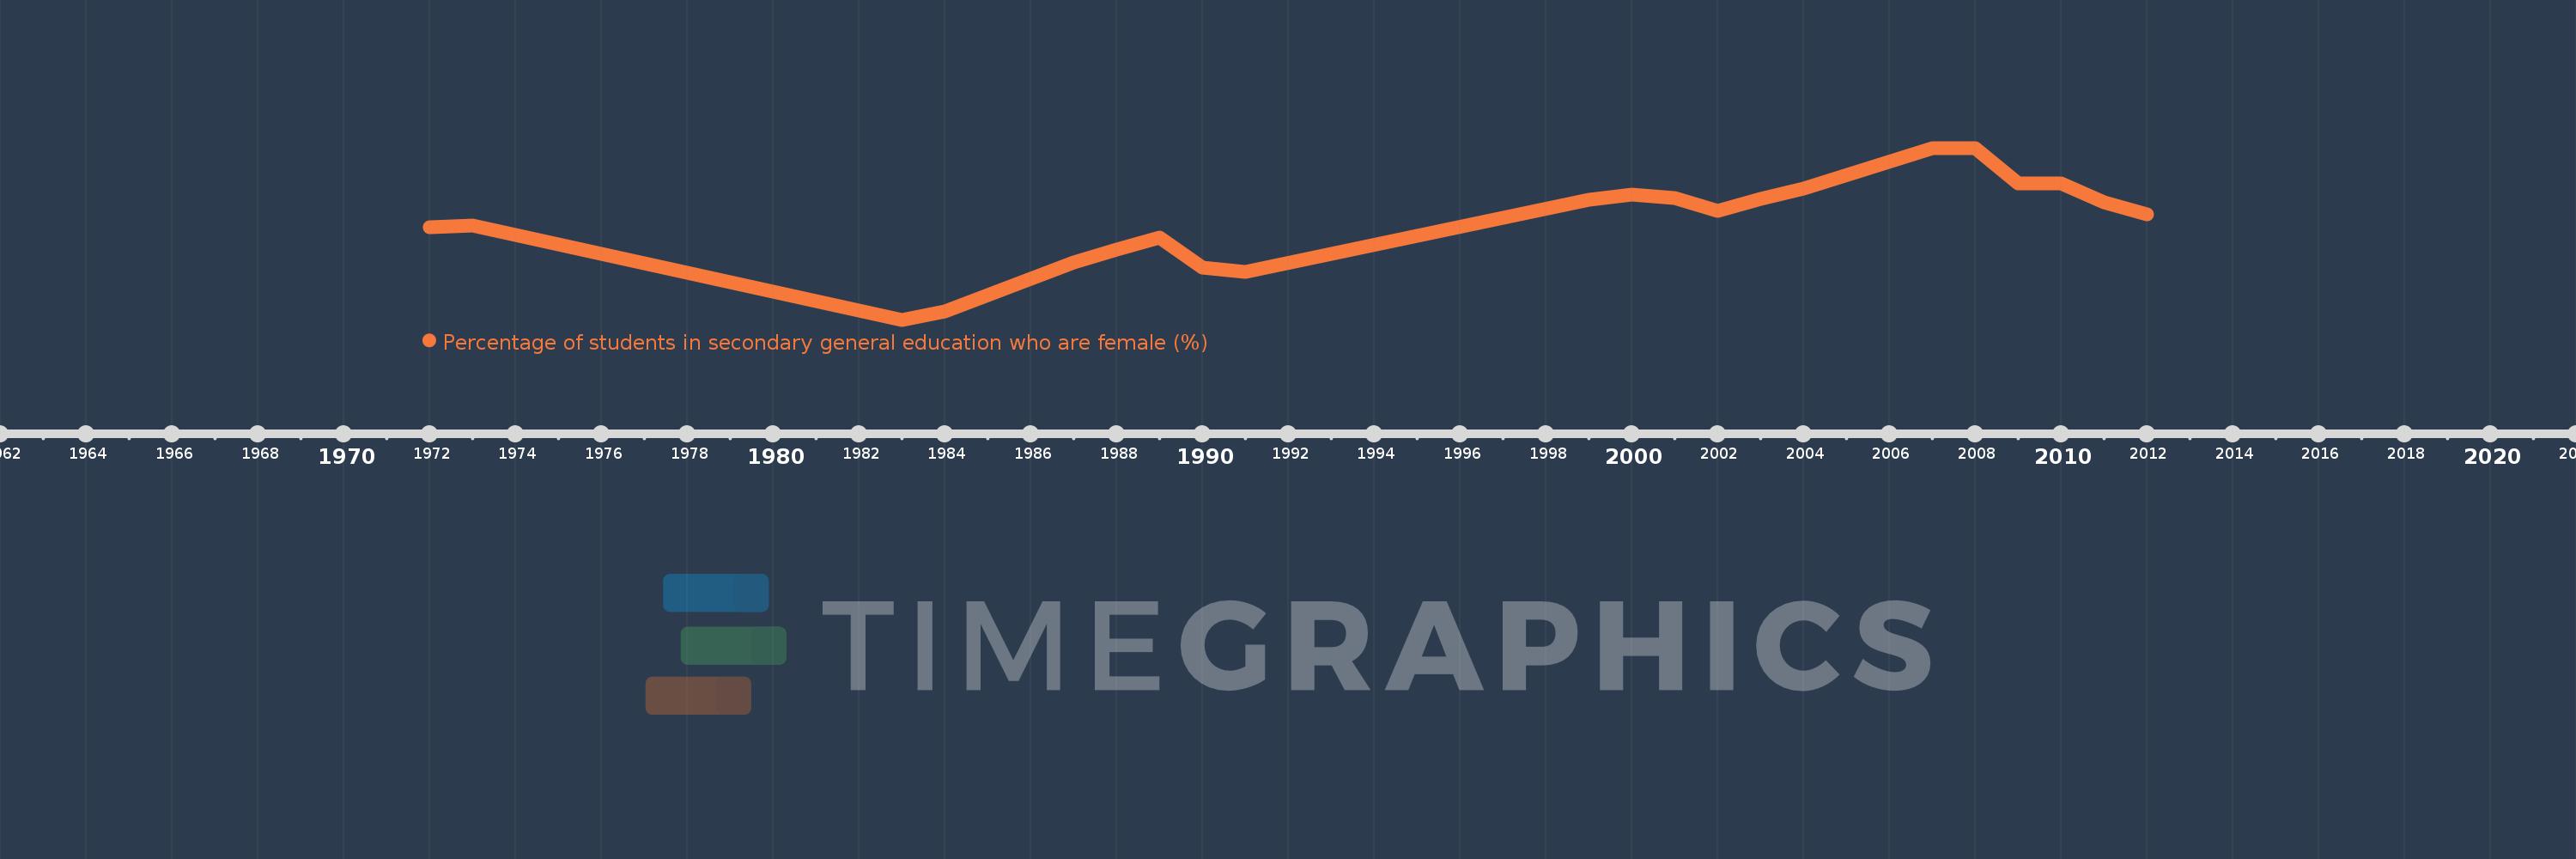
Percentage of students in secondary general education who are female (%)
2012,2011,2010,2009,2008,2007,2004,2003,2002,2001,2000,1999,1991,1990,1989,1988,1987,1984,1983,1973,1972