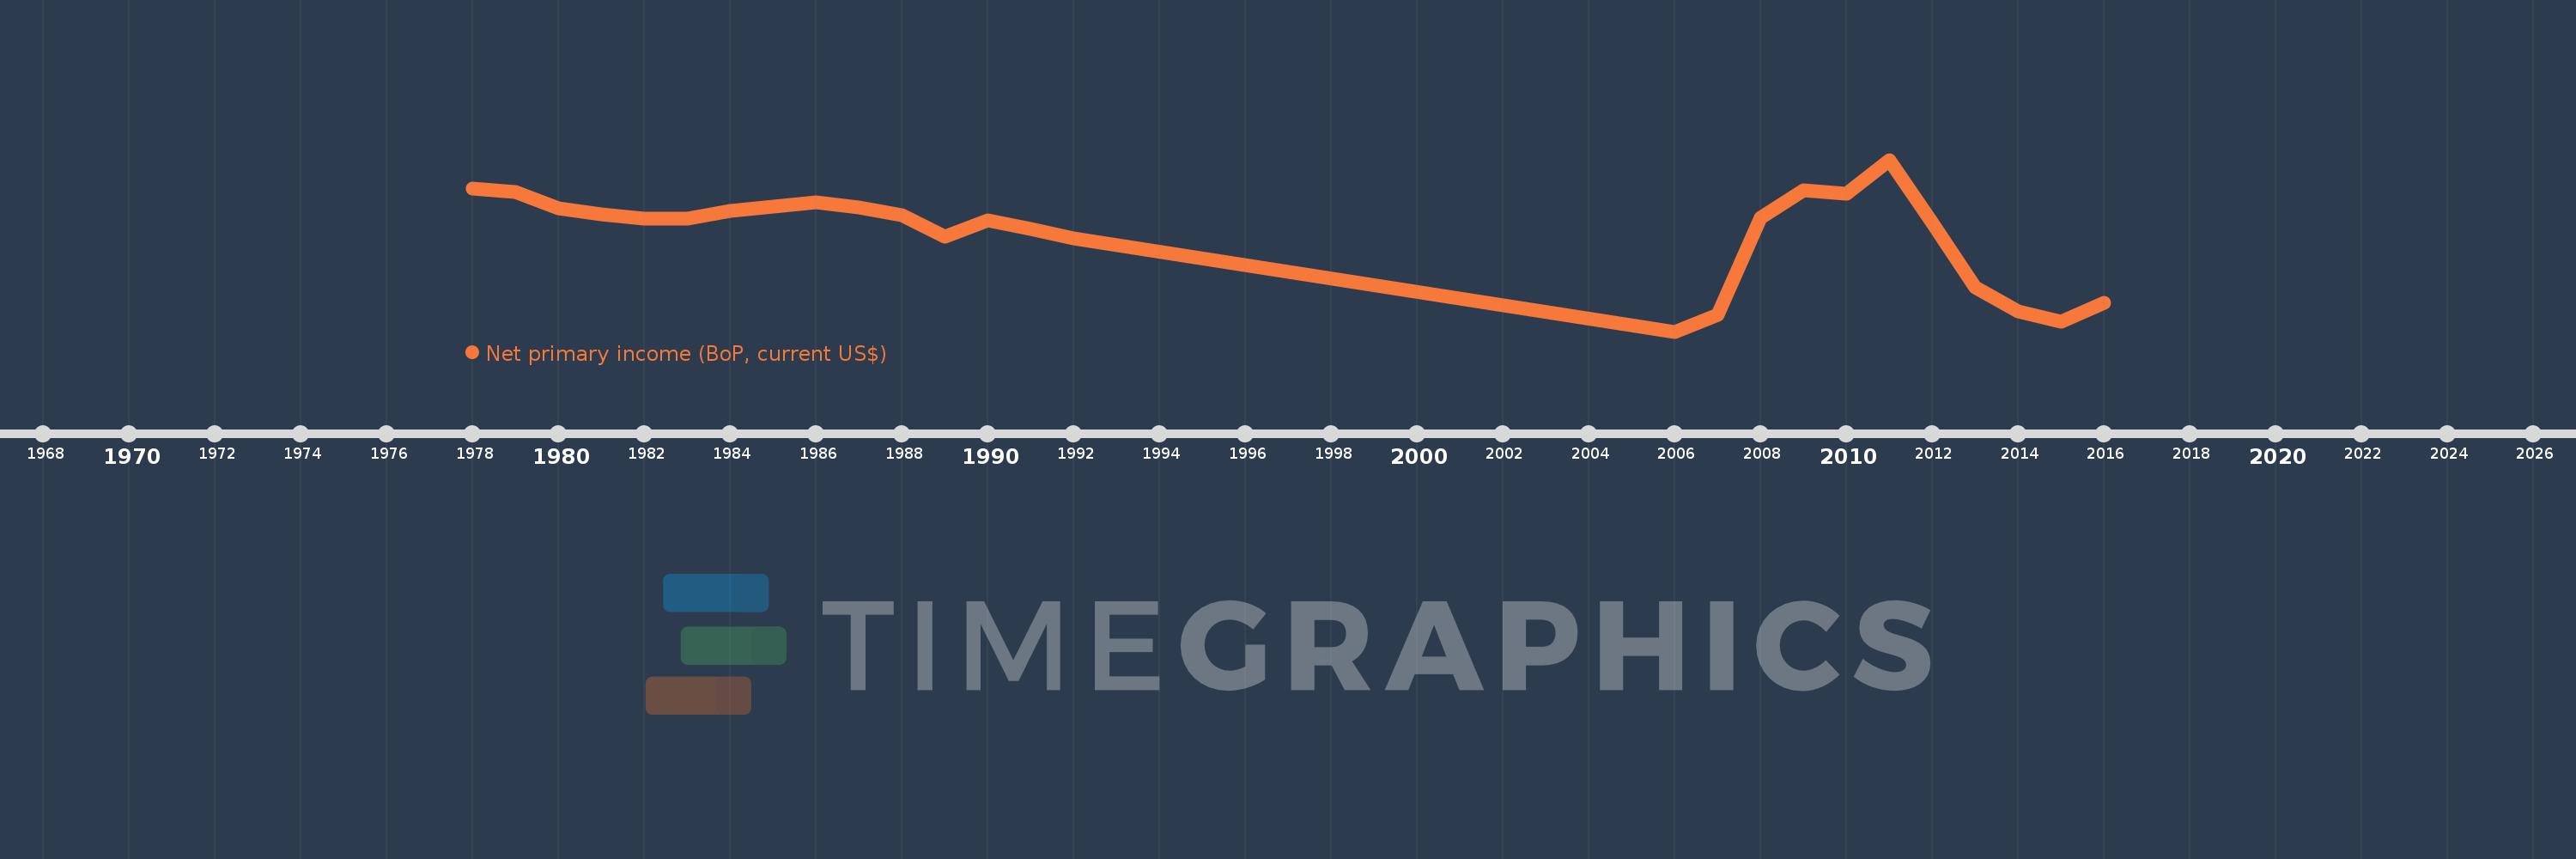
Cette échelle de temps montre un graphique de 1978 année à 2016 année Algeria. Les données jusqu'à 1977 année ne sont pas présentés. Quantité d'observations actuelles selon dates: 26.
Source (désignation):
Les indicateurs du développement mondiale
Source (organisation):
International Monetary Fund, Balance of Payments Statistics Yearbook and data files.
Catégories:
Economy & Growth
Dernière mise à jour
23 avr. 2017
Les indicateurs de changement de valeurs selon les années
En moyenne:
-2.394 mds
Minimum:
-5.088 mds
1 janv. 2006
Maximum:
-387.358 mln.
1 janv. 2011
Pour la date d''observation
Valeur
Changement absolu
Le changement par rapport à la valeur précédente
1 janv. 1978
-1.171 mds
-1.171 mds
0.0%
1 janv. 1979
-1.266 mds
-94.997 mln.
8.11%
1 janv. 1980
-1.706 mds
-440.294 mln.
34.78%
1 janv. 1981
-1.869 mds
-162.604 mln.
9.53%
1 janv. 1982
-2.0 mds
-131.632 mln.
7.04%
1 janv. 1983
-1.989 mds
+11.074 mln.
-0.55%
1 janv. 1984
-1.792 mds
+197.357 mln.
-9.92%
1 janv. 1985
-1.679 mds
+112.907 mln.
-6.3%
1 janv. 1986
-1.544 mds
+134.768 mln.
-8.03%
1 janv. 1987
-1.693 mds
-148.781 mln.
9.63%
1 janv. 1988
-1.899 mds
-205.869 mln.
12.16%
1 janv. 1989
-2.499 mds
-599.967 mln.
31.6%
1 janv. 1990
-2.047 mds
+452.319 mln.
-18.1%
1 janv. 1991
-2.268 mds
-221.419 mln.
10.82%
1 janv. 1992
-2.548 mds
-279.697 mln.
12.33%
1 janv. 2006
-5.088 mds
-2.54 mds
99.72%
1 janv. 2007
-4.635 mds
+453.0 mln.
-8.9%
1 janv. 2008
-1.977 mds
+2.658 mds
-57.34%
1 janv. 2009
-1.231 mds
+746.532 mln.
-37.76%
1 janv. 2010
-1.313 mds
-82.039 mln.
6.67%
1 janv. 2011
-387.358 mln.
+925.298 mln.
-70.49%
1 janv. 2012
-2.114 mds
-1.726 mds
445.66%
1 janv. 2013
-3.872 mds
-1.758 mds
83.2%
1 janv. 2014
-4.527 mds
-654.442 mln.
16.9%
1 janv. 2015
-4.819 mds
-292.197 mln.
6.46%
1 janv. 2016
-4.312 mds
+506.453 mln.
-10.51%
Classement des pays selon les statistiques actuelles par années