33
/fr/
AIzaSyAYiBZKx7MnpbEhh9jyipgxe19OcubqV5w
August 1, 2025
63531
Afghanistan
AFG
true
2
1
Goods exports (BoP, current US$)
2016,2015,2014,2013,2012,2011,2010,2009,1990,1989,1988,1987,1986,1985,1984,1983,1982,1981,1980
Download
Bibliothèque de statistiques globales →Afghanistan →

Goods exports (BoP, current US$)

Cette statistique dans les autres pays:

AfghanistanAlbaniaAlgeriaAngolaAntigua and BarbudaArab WorldArgentinaArmeniaArubaAustraliaAustriaAzerbaijanBahamas, TheBahrainBangladeshBarbadosBelarusBelgiumBelizeBeninBermudaBhutanBoliviaBosnia and HerzegovinaBotswanaBrazilBrunei DarussalamBulgariaBurkina FasoBurundiCabo VerdeCambodiaCameroonCanadaCaribbean small statesCentral African RepublicCentral Europe and the BalticsChadChileChinaColombiaComorosCongo, Dem. Rep.Congo, Rep.Costa RicaCote d'IvoireCroatiaCuracaoCyprusCzech RepublicDenmarkDjiboutiDominicaDominican RepublicEarly-demographic dividendEast Asia & PacificEast Asia & Pacific (excluding high income)East Asia & Pacific (IDA & IBRD countries)EcuadorEgypt, Arab Rep.El SalvadorEquatorial GuineaEritreaEstoniaEthiopiaEuro areaEurope & Central AsiaEurope & Central Asia (excluding high income)Europe & Central Asia (IDA & IBRD countries)European UnionFaroe IslandsFijiFinlandFragile and conflict affected situationsFranceFrench PolynesiaGabonGambia, TheGeorgiaGermanyGhanaGreeceGrenadaGuatemalaGuineaGuinea-BissauGuyanaHaitiHeavily indebted poor countries (HIPC)High incomeHondurasHong Kong SAR, ChinaHungaryIBRD onlyIcelandIDA & IBRD totalIDA blendIDA onlyIDA totalIndiaIndonesiaIran, Islamic Rep.IraqIrelandIsraelItalyJamaicaJapanJordanKazakhstanKenyaKiribatiKorea, Rep.KosovoKuwaitKyrgyz RepublicLao PDRLate-demographic dividendLatin America & Caribbean Latin America & Caribbean (excluding high income)Latin America & the Caribbean (IDA & IBRD countries)LatviaLeast developed countries: UN classificationLebanonLesothoLiberiaLibyaLithuaniaLow & middle incomeLow incomeLower middle incomeLuxembourgMacao SAR, ChinaMacedonia, FYRMadagascarMalawiMalaysiaMaldivesMaliMaltaMarshall IslandsMauritaniaMauritiusMexicoMicronesia, Fed. Sts.Middle East & North Africa (excluding high income)Middle East & North Africa (IDA & IBRD countries)Middle incomeMoldovaMongoliaMontenegroMoroccoMozambiqueMyanmarNamibiaNepalNetherlandsNew CaledoniaNew ZealandNicaraguaNigerNigeriaNorth AmericaNorwayOECD membersOmanPacific island small statesPakistanPalauPanamaPapua New GuineaParaguayPeruPhilippinesPolandPortugalPost-demographic dividendPre-demographic dividendQatarRomaniaRussian FederationRwandaSamoaSao Tome and PrincipeSaudi ArabiaSenegalSerbiaSeychellesSierra LeoneSingaporeSint Maarten (Dutch part)Slovak RepublicSloveniaSolomon IslandsSouth AfricaSouth AsiaSouth Asia (IDA & IBRD)South SudanSpainSri LankaSt. Kitts and NevisSt. LuciaSt. Vincent and the GrenadinesSub-Saharan Africa Sub-Saharan Africa (excluding high income)Sub-Saharan Africa (IDA & IBRD countries)SudanSurinameSwazilandSwedenSwitzerlandSyrian Arab RepublicTajikistanTanzaniaThailandTimor-LesteTogoTongaTrinidad and TobagoTunisiaTurkeyTuvaluUgandaUkraineUnited KingdomUnited StatesUpper middle incomeUruguayVanuatuVenezuela, RBVietnamWest Bank and GazaWorldYemen, Rep.ZambiaZimbabwe

La ligne de temps

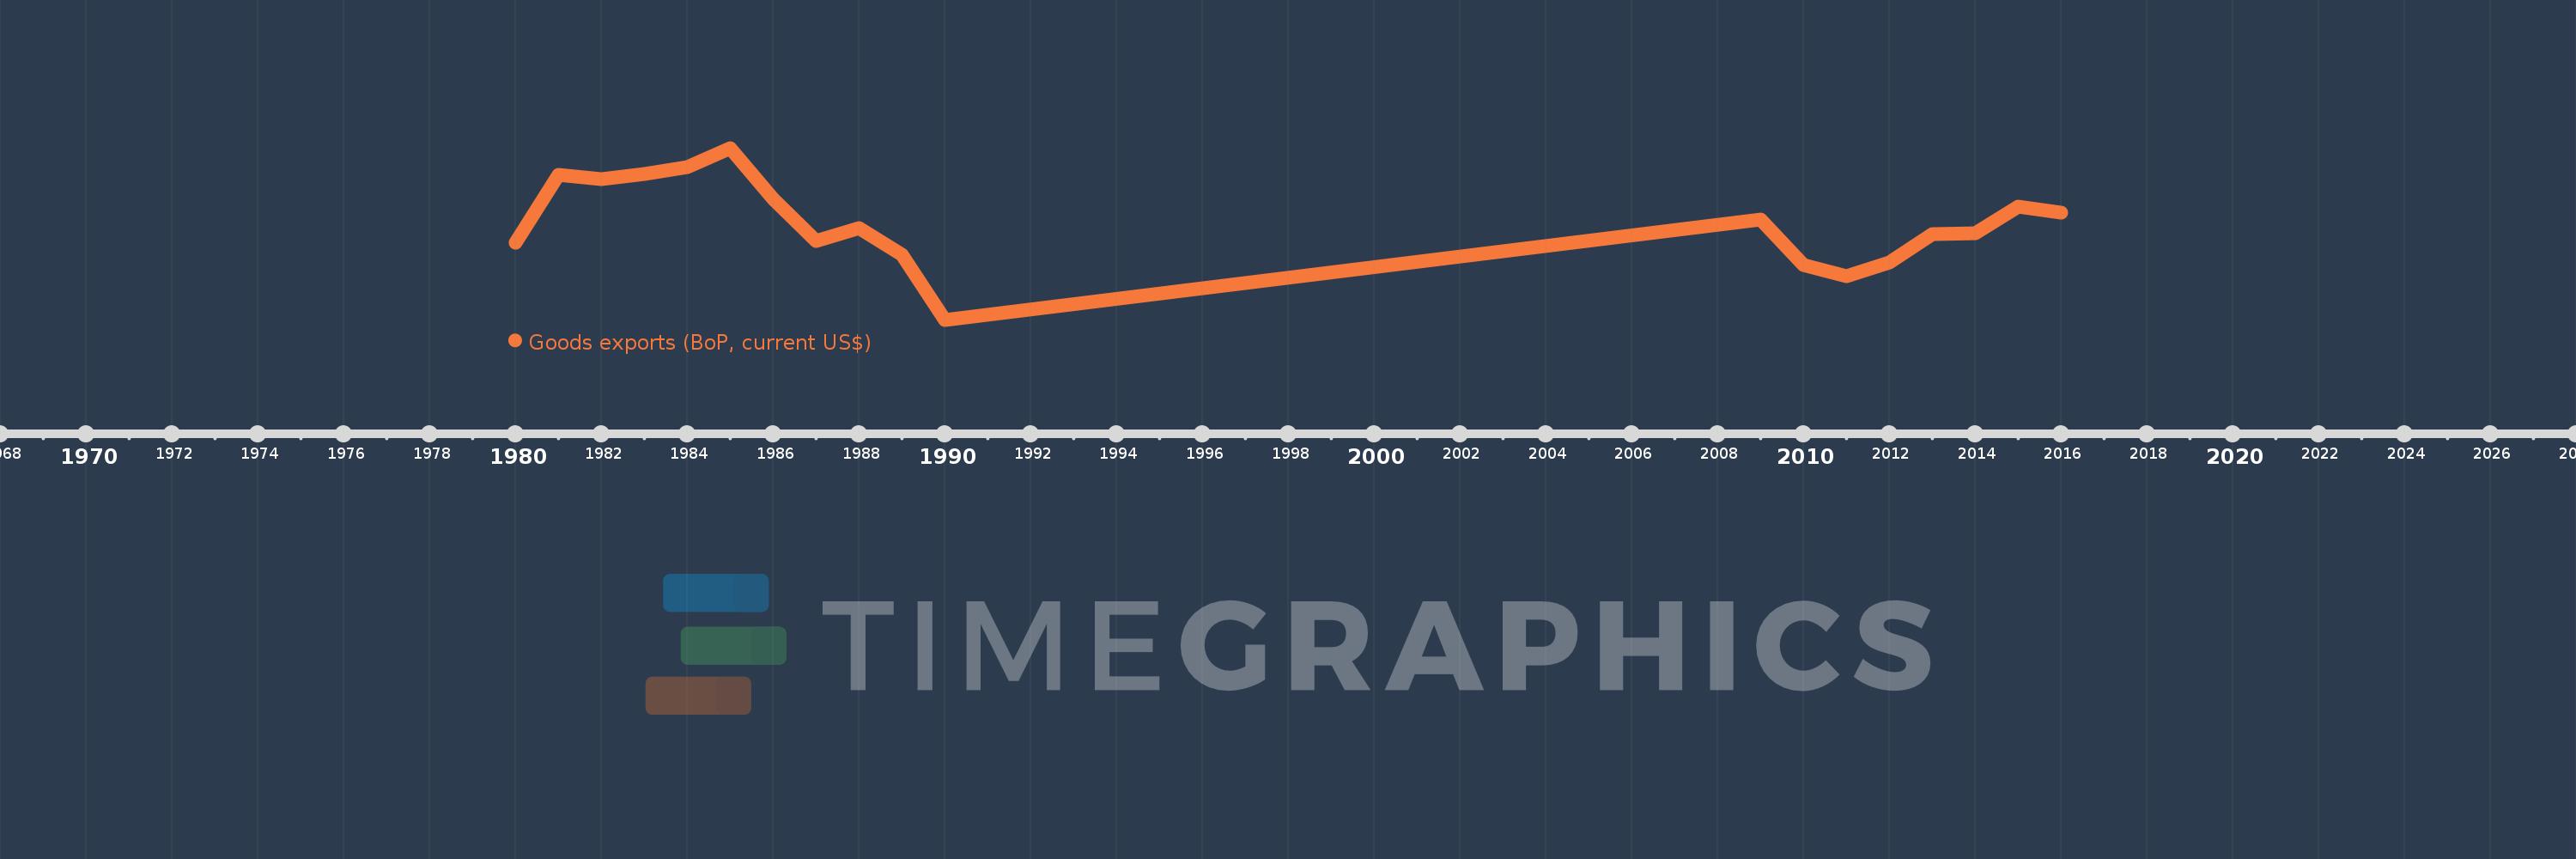
Cette échelle de temps montre un graphique de 1980 année à 2016 année Afghanistan. Les données jusqu'à 1979 année ne sont pas présentés. Quantité d'observations actuelles selon dates: 19.

Source (désignation):

Les indicateurs du développement mondiale

Source (organisation):

International Monetary Fund, Balance of Payments Statistics Yearbook and data files.

Catégories:

Economy & Growth, Trade

Dernière mise à jour

23 avr. 2017

Les indicateurs de changement de valeurs selon les années

En moyenne:
553.776 mln.
Minimum:
252.3 mln.
1 janv. 1990
Maximum:
787.7 mln.
1 janv. 1985
Pour la date d''observation
Valeur
Changement absolu
Le changement par rapport à la valeur précédente
1 janv. 1980
493.7 mln.
+493.7 mln.
0.0%
1 janv. 1981
705.2 mln.
+211.5 mln.
42.84%
1 janv. 1982
690.8 mln.
-14.4 mln.
-2.04%
1 janv. 1983
707.8 mln.
+17.0 mln.
2.46%
1 janv. 1984
728.8 mln.
+21.0 mln.
2.97%
1 janv. 1985
787.7 mln.
+58.9 mln.
8.08%
1 janv. 1986
628.2 mln.
-159.5 mln.
-20.25%
1 janv. 1987
497.0 mln.
-131.2 mln.
-20.89%
1 janv. 1988
538.7 mln.
+41.7 mln.
8.39%
1 janv. 1989
453.8 mln.
-84.9 mln.
-15.76%
1 janv. 1990
252.3 mln.
-201.5 mln.
-44.4%
1 janv. 2009
563.374 mln.
+311.074 mln.
123.3%
1 janv. 2010
423.13 mln.
-140.244 mln.
-24.89%
1 janv. 2011
389.104 mln.
-34.026 mln.
-8.04%
1 janv. 2012
430.752 mln.
+41.649 mln.
10.7%
1 janv. 2013
519.746 mln.
+88.994 mln.
20.66%
1 janv. 2014
522.91 mln.
+3.164 mln.
0.61%
1 janv. 2015
603.71 mln.
+80.8 mln.
15.45%
1 janv. 2016
585.016 mln.
-18.694 mln.
-3.1%

Classement des pays selon les statistiques actuelles par années