33
/fr/
AIzaSyAYiBZKx7MnpbEhh9jyipgxe19OcubqV5w
August 1, 2025
51970
North America
NAC
false
2
1
International tourism, number of arrivals
2015,2014,2013,2012,2011,2010,2009,2008,2007,2006,2005,2004,2003,2002,2001,2000,1999,1998,1997,1996
Download
Bibliothèque de statistiques globales →North America →

International tourism, number of arrivals

Cette statistique dans les autres pays:

AlbaniaAlgeriaAmerican SamoaAndorraAngolaAntigua and BarbudaArab WorldArgentinaArmeniaArubaAustraliaAustriaAzerbaijanBahamas, TheBahrainBangladeshBarbadosBelarusBelgiumBelizeBeninBermudaBhutanBoliviaBosnia and HerzegovinaBotswanaBrazilBritish Virgin IslandsBrunei DarussalamBulgariaBurkina FasoBurundiCabo VerdeCambodiaCameroonCanadaCaribbean small statesCayman IslandsCentral African RepublicCentral Europe and the BalticsChadChileChinaColombiaComorosCongo, Dem. Rep.Congo, Rep.Costa RicaCote d'IvoireCroatiaCubaCuracaoCyprusCzech RepublicDenmarkDjiboutiDominicaDominican RepublicEarly-demographic dividendEast Asia & PacificEast Asia & Pacific (excluding high income)East Asia & Pacific (IDA & IBRD countries)EcuadorEgypt, Arab Rep.El SalvadorEritreaEstoniaEthiopiaEuro areaEurope & Central AsiaEurope & Central Asia (excluding high income)Europe & Central Asia (IDA & IBRD countries)European UnionFijiFinlandFragile and conflict affected situationsFranceFrench PolynesiaGabonGambia, TheGeorgiaGermanyGhanaGreeceGrenadaGuamGuatemalaGuineaGuinea-BissauGuyanaHaitiHeavily indebted poor countries (HIPC)High incomeHondurasHong Kong SAR, ChinaHungaryIBRD onlyIcelandIDA & IBRD totalIDA blendIDA onlyIDA totalIndiaIndonesiaIran, Islamic Rep.IraqIrelandIsraelItalyJamaicaJapanJordanKazakhstanKenyaKiribatiKorea, Rep.KuwaitKyrgyz RepublicLao PDRLate-demographic dividendLatin America & Caribbean Latin America & Caribbean (excluding high income)Latin America & the Caribbean (IDA & IBRD countries)LatviaLeast developed countries: UN classificationLebanonLesothoLibyaLiechtensteinLithuaniaLow & middle incomeLow incomeLower middle incomeLuxembourgMacao SAR, ChinaMacedonia, FYRMadagascarMalawiMalaysiaMaldivesMaliMaltaMarshall IslandsMauritaniaMauritiusMexicoMicronesia, Fed. Sts.Middle East & North AfricaMiddle East & North Africa (excluding high income)Middle East & North Africa (IDA & IBRD countries)Middle incomeMoldovaMonacoMongoliaMontenegroMoroccoMozambiqueMyanmarNamibiaNepalNetherlandsNew CaledoniaNew ZealandNicaraguaNigerNigeriaNorth AmericaNorthern Mariana IslandsNorwayOECD membersOmanOther small statesPacific island small statesPakistanPalauPanamaPapua New GuineaParaguayPeruPhilippinesPolandPortugalPost-demographic dividendPre-demographic dividendPuerto RicoQatarRomaniaRussian FederationRwandaSamoaSan MarinoSao Tome and PrincipeSaudi ArabiaSenegalSerbiaSeychellesSierra LeoneSingaporeSint Maarten (Dutch part)Slovak RepublicSloveniaSmall statesSolomon IslandsSouth AfricaSouth AsiaSouth Asia (IDA & IBRD)SpainSri LankaSt. Kitts and NevisSt. LuciaSt. Vincent and the GrenadinesSub-Saharan Africa Sub-Saharan Africa (excluding high income)Sub-Saharan Africa (IDA & IBRD countries)SudanSurinameSwazilandSwedenSwitzerlandSyrian Arab RepublicTajikistanTanzaniaThailandTimor-LesteTogoTongaTrinidad and TobagoTunisiaTurkeyTurkmenistanTurks and Caicos IslandsTuvaluUgandaUkraineUnited Arab EmiratesUnited KingdomUnited StatesUpper middle incomeUruguayUzbekistanVanuatuVenezuela, RBVietnamVirgin Islands (U.S.)West Bank and GazaWorldYemen, Rep.ZambiaZimbabwe

La ligne de temps

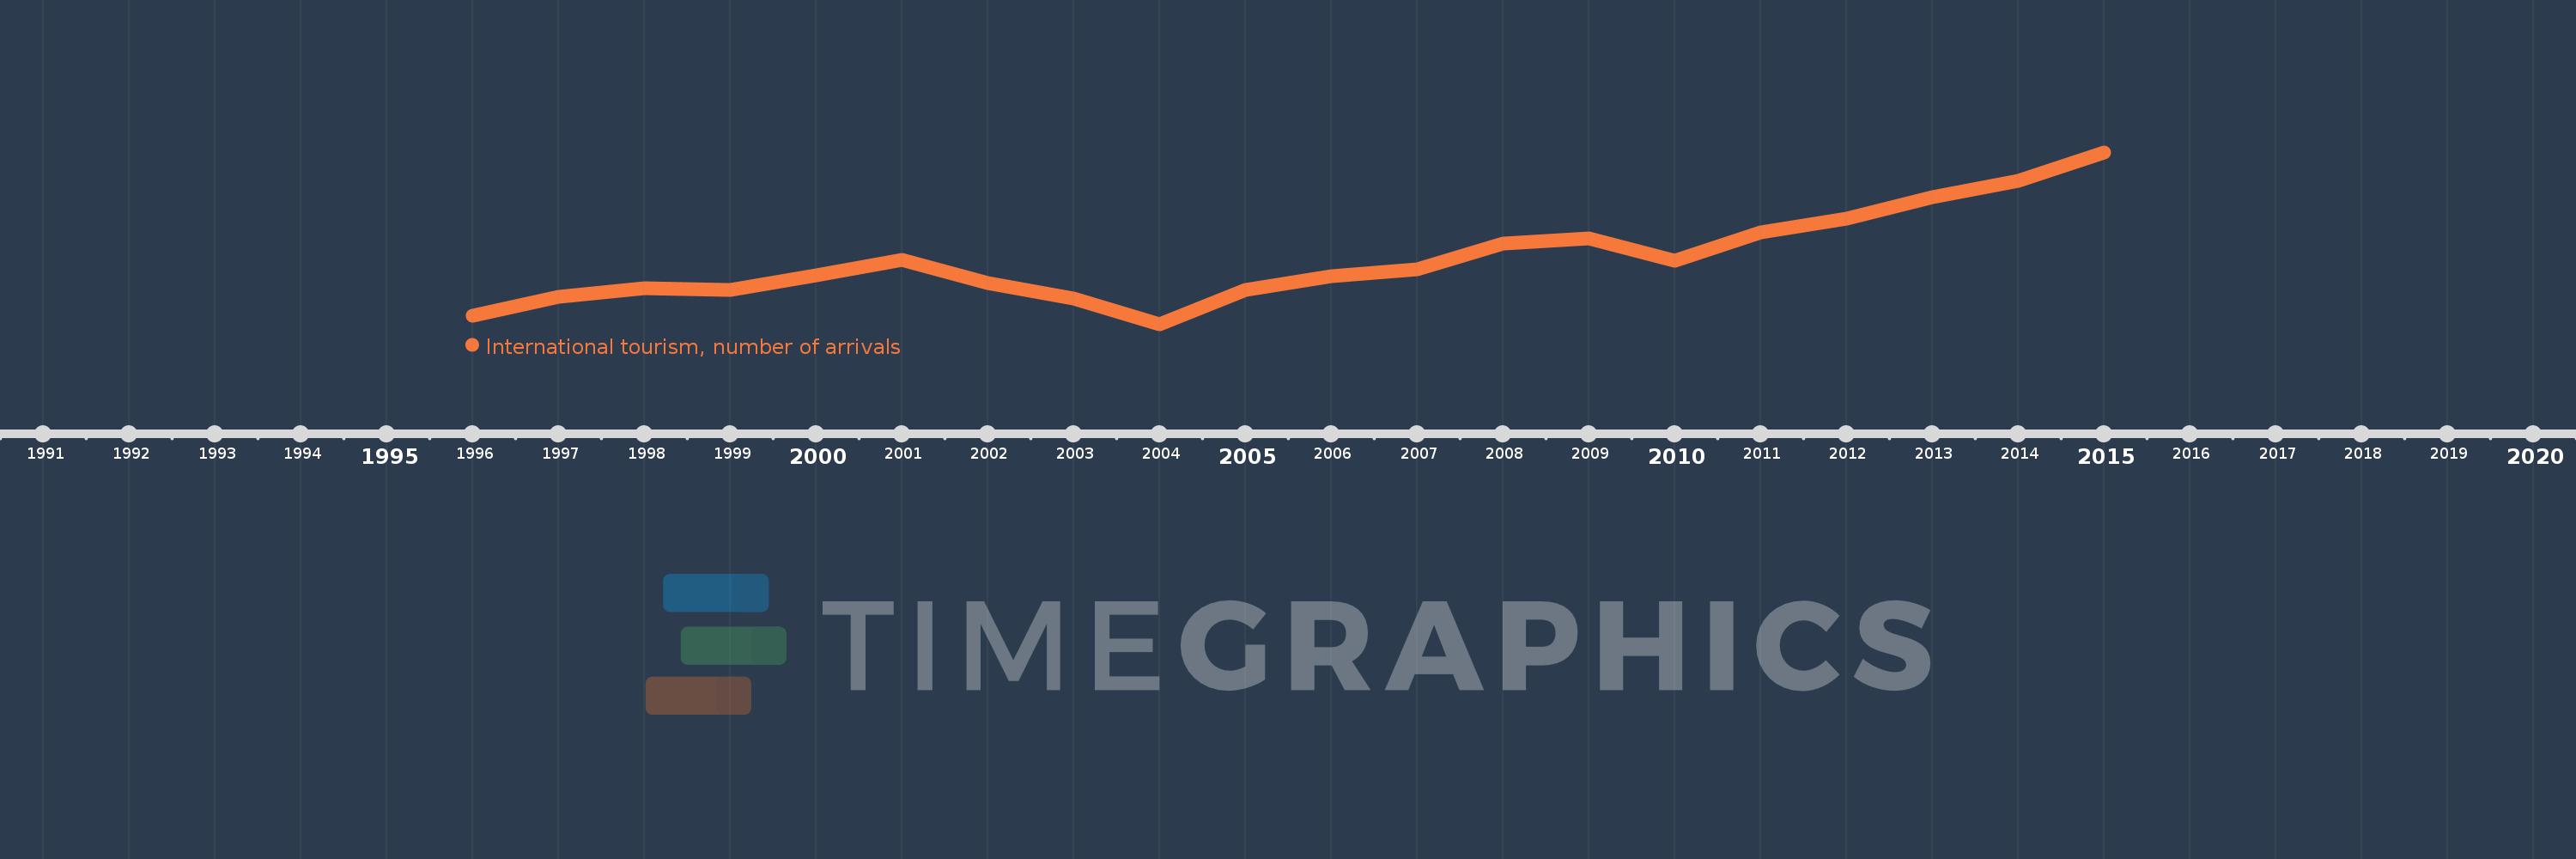
Cette échelle de temps montre un graphique de 1996 année à 2015 année North America. Les données jusqu'à 1995 année ne sont pas présentés. Quantité d'observations actuelles selon dates: 20.

Source (désignation):

Les indicateurs du développement mondiale

Source (organisation):

World Tourism Organization, Yearbook of Tourism Statistics, Compendium of Tourism Statistics and data files.

Catégories:

Private Sector, Trade

Dernière mise à jour

23 avr. 2017

Les indicateurs de changement de valeurs selon les années

En moyenne:
71.325 mln.
Minimum:
59.009 mln.
1 janv. 2004
Maximum:
91.772 mln.
1 janv. 2015
Pour la date d''observation
Valeur
Changement absolu
Le changement par rapport à la valeur précédente
1 janv. 1996
60.637 mln.
+60.637 mln.
0.0%
1 janv. 1997
64.165 mln.
+3.528 mln.
5.82%
1 janv. 1998
65.816 mln.
+1.651 mln.
2.57%
1 janv. 1999
65.617 mln.
-199.0 milles
-0.3%
1 janv. 2000
68.275 mln.
+2.658 mln.
4.05%
1 janv. 2001
71.197 mln.
+2.922 mln.
4.28%
1 janv. 2002
66.884 mln.
-4.313 mln.
-6.06%
1 janv. 2003
63.922 mln.
-2.962 mln.
-4.43%
1 janv. 2004
59.009 mln.
-4.913 mln.
-7.69%
1 janv. 2005
65.503 mln.
+6.494 mln.
11.01%
1 janv. 2006
68.247 mln.
+2.744 mln.
4.19%
1 janv. 2007
69.541 mln.
+1.294 mln.
1.9%
1 janv. 2008
74.376 mln.
+4.835 mln.
6.95%
1 janv. 2009
75.413 mln.
+1.037 mln.
1.39%
1 janv. 2010
71.076 mln.
-4.337 mln.
-5.75%
1 janv. 2011
76.461 mln.
+5.385 mln.
7.58%
1 janv. 2012
79.071 mln.
+2.61 mln.
3.41%
1 janv. 2013
83.233 mln.
+4.162 mln.
5.26%
1 janv. 2014
86.29 mln.
+3.057 mln.
3.67%
1 janv. 2015
91.772 mln.
+5.482 mln.
6.35%

Classement des pays selon les statistiques actuelles par années