33
/fr/
AIzaSyAYiBZKx7MnpbEhh9jyipgxe19OcubqV5w
August 1, 2025
43109
Latin America & Caribbean (excluding high income)
LAC
false
2
1
Unemployment with primary education (% of total unemployment)
2012,2008,2007,2006,2005,2004,2003,2002
Download
Bibliothèque de statistiques globales →Latin America & Caribbean (excluding high income) →

Unemployment with primary education (% of total unemployment)

Cette statistique dans les autres pays:

AlbaniaAlgeriaArgentinaArmeniaArubaAustraliaAustriaAzerbaijanBahamas, TheBahrainBangladeshBarbadosBelarusBelgiumBelizeBermudaBhutanBoliviaBosnia and HerzegovinaBotswanaBrazilBritish Virgin IslandsBrunei DarussalamBulgariaBurkina FasoCanadaCaribbean small statesCayman IslandsCentral African RepublicCentral Europe and the BalticsChadChileColombiaCosta RicaCroatiaCubaCyprusCzech RepublicDenmarkDominicaDominican RepublicEarly-demographic dividendEcuadorEgypt, Arab Rep.El SalvadorEstoniaEthiopiaEuro areaEurope & Central AsiaEurope & Central Asia (excluding high income)Europe & Central Asia (IDA & IBRD countries)European UnionFijiFinlandFranceFrench PolynesiaGabonGeorgiaGermanyGreeceGuatemalaHigh incomeHondurasHong Kong SAR, ChinaHungaryIcelandIndiaIndonesiaIran, Islamic Rep.IrelandIsraelItalyJamaicaJapanJordanKazakhstanKorea, Rep.KosovoKuwaitKyrgyz RepublicLatin America & Caribbean Latin America & Caribbean (excluding high income)Latin America & the Caribbean (IDA & IBRD countries)LatviaLebanonLesothoLithuaniaLower middle incomeLuxembourgMacao SAR, ChinaMacedonia, FYRMadagascarMalaysiaMaltaMauritiusMexicoMiddle East & North AfricaMiddle East & North Africa (excluding high income)Middle East & North Africa (IDA & IBRD countries)MoldovaMongoliaMontenegroMoroccoNamibiaNetherlandsNew CaledoniaNew ZealandNicaraguaNorth AmericaNorwayOECD membersOmanPakistanPanamaParaguayPeruPhilippinesPolandPortugalPost-demographic dividendQatarRomaniaRussian FederationRwandaSan MarinoSaudi ArabiaSenegalSerbiaSingaporeSlovak RepublicSloveniaSouth AfricaSouth AsiaSouth Asia (IDA & IBRD)SpainSri LankaSt. LuciaSt. Vincent and the GrenadinesSurinameSwedenSwitzerlandSyrian Arab RepublicTajikistanTanzaniaThailandTimor-LesteTongaTrinidad and TobagoTunisiaTurkeyUkraineUnited Arab EmiratesUnited KingdomUnited StatesUruguayVenezuela, RBWest Bank and GazaZimbabwe

La ligne de temps

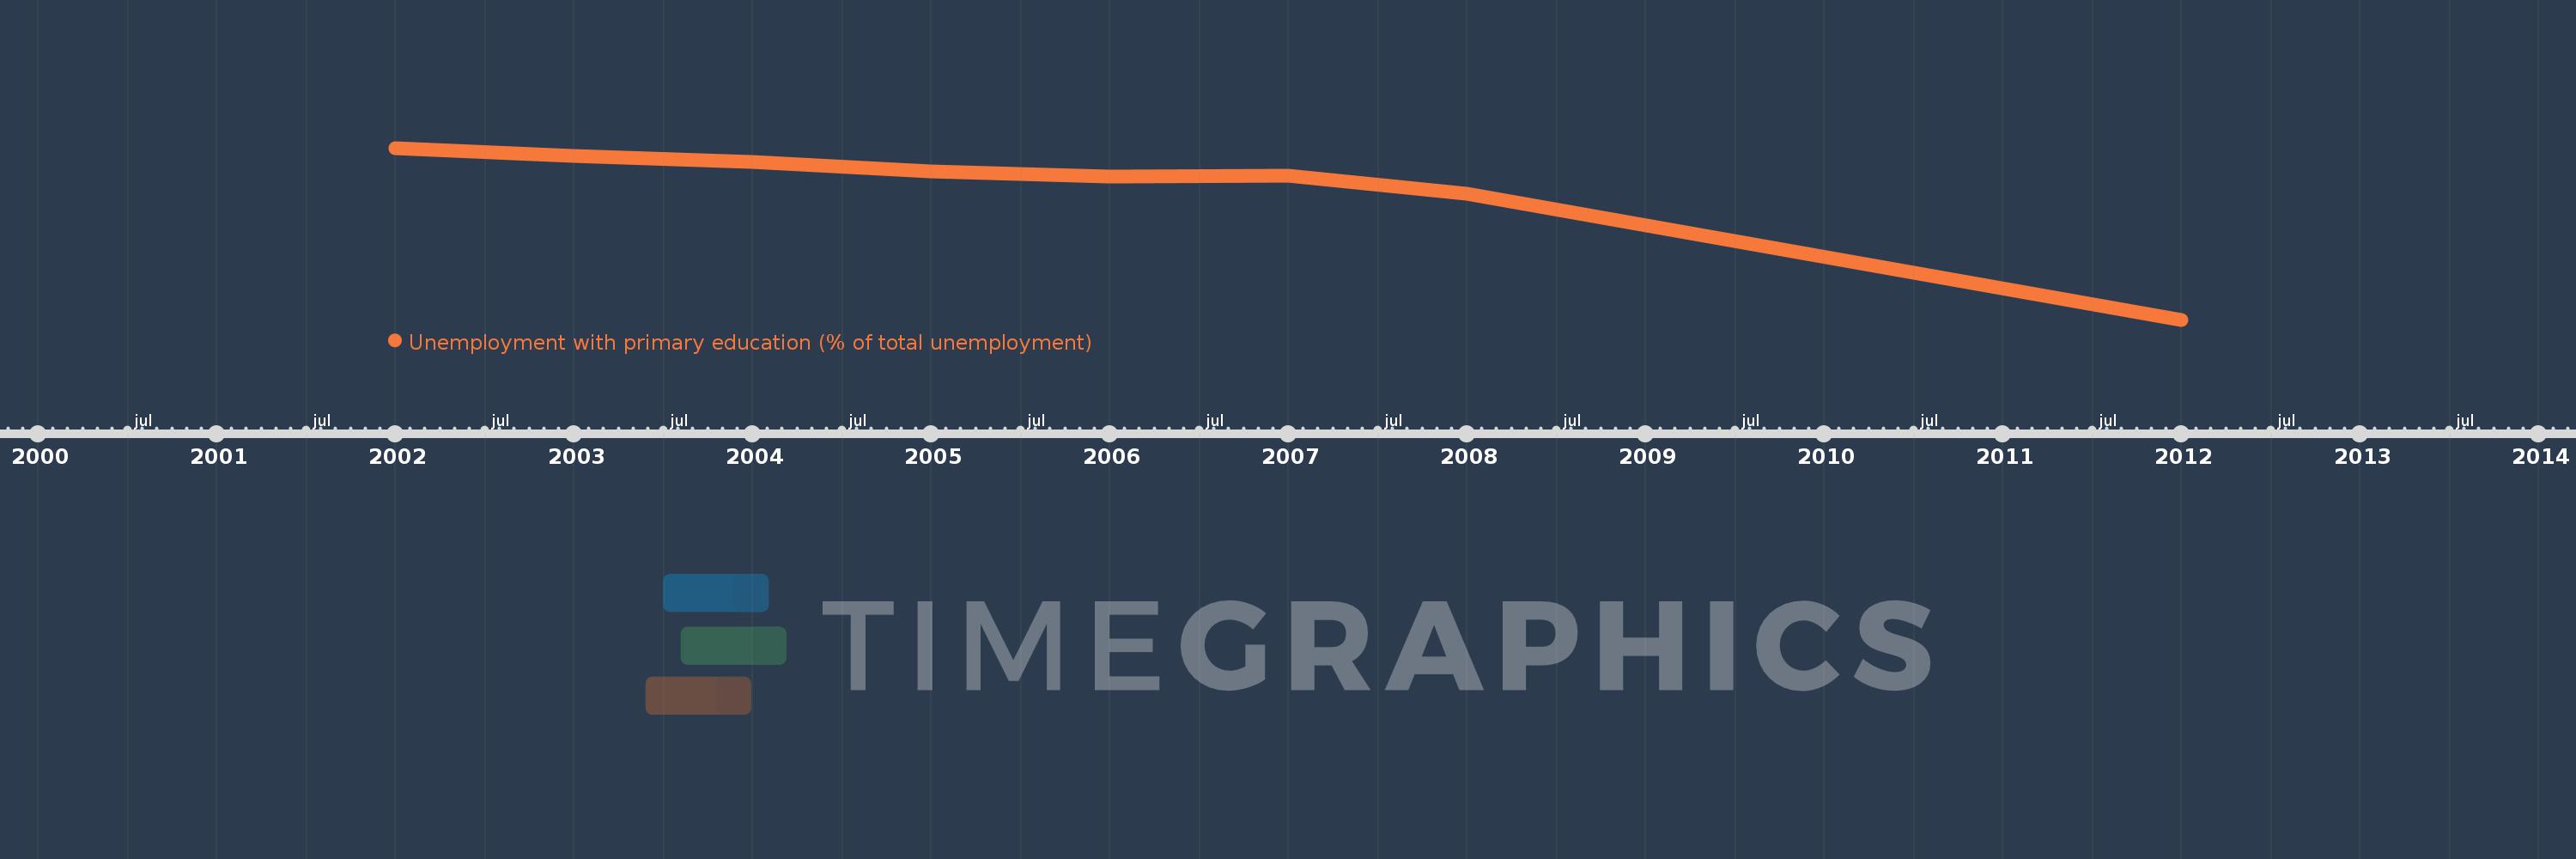
Cette échelle de temps montre un graphique de 2002 année à 2012 année Latin America & Caribbean (excluding high income). Les données jusqu'à 2001 année ne sont pas présentés. Quantité d'observations actuelles selon dates: 8.

Source (désignation):

Les indicateurs du développement mondiale

Source (organisation):

International Labour Organization, Key Indicators of the Labour Market database.

Catégories:

Social Protection & Labor

Dernière mise à jour

23 avr. 2017

Les indicateurs de changement de valeurs selon les années

En moyenne:
42.231
Minimum:
27.72
1 janv. 2012
Maximum:
46.638
1 janv. 2002
Pour la date d''observation
Valeur
Changement absolu
Le changement par rapport à la valeur précédente
1 janv. 2002
46.638
+46.638
0.0%
1 janv. 2003
45.722
-0.916
-1.96%
1 janv. 2004
45.073
-0.649
-1.42%
1 janv. 2005
44.035
-1.038
-2.3%
1 janv. 2006
43.489
-0.546
-1.24%
1 janv. 2007
43.582
+0.092
0.21%
1 janv. 2008
41.588
-1.994
-4.58%
1 janv. 2012
27.72
-13.868
-33.35%

Classement des pays selon les statistiques actuelles par années