30
/fr/
AIzaSyAYiBZKx7MnpbEhh9jyipgxe19OcubqV5w
April 1, 2024
39236
IDA only
IDX
false
2
1
Net bilateral aid flows from DAC donors, Czech Republic (current US$)
2015,2014,2013,2012,2011,2010,2009,2008,2007,2006
Download
Bibliothèque de statistiques globales →IDA only →

Net bilateral aid flows from DAC donors, Czech Republic (current US$)

Cette statistique dans les autres pays:

AfghanistanAlbaniaAlgeriaAngolaAntigua and BarbudaArab WorldArgentinaArmeniaAzerbaijanBangladeshBelarusBelizeBeninBhutanBoliviaBosnia and HerzegovinaBrazilBurkina FasoBurundiCabo VerdeCambodiaCameroonCaribbean small statesCentral African RepublicCentral Europe and the BalticsChadChileChinaColombiaCongo, Dem. Rep.Congo, Rep.Costa RicaCote d'IvoireCroatiaCubaDjiboutiDominicaDominican RepublicEast Asia & PacificEast Asia & Pacific (excluding high income)East Asia & Pacific (IDA & IBRD countries)EcuadorEgypt, Arab Rep.El SalvadorEritreaEthiopiaEurope & Central AsiaEurope & Central Asia (excluding high income)Europe & Central Asia (IDA & IBRD countries)European UnionFragile and conflict affected situationsGabonGambia, TheGeorgiaGhanaGuatemalaGuineaGuinea-BissauHaitiHeavily indebted poor countries (HIPC)High incomeHondurasIBRD onlyIDA & IBRD totalIDA blendIDA onlyIDA totalIndiaIndonesiaIran, Islamic Rep.IraqJamaicaJordanKazakhstanKenyaKorea, Dem. People’s Rep.KosovoKyrgyz RepublicLao PDRLatin America & Caribbean Latin America & Caribbean (excluding high income)Latin America & the Caribbean (IDA & IBRD countries)Least developed countries: UN classificationLebanonLesothoLiberiaLibyaLow & middle incomeLow incomeLower middle incomeMacedonia, FYRMalawiMalaysiaMaldivesMaliMauritaniaMexicoMiddle East & North AfricaMiddle East & North Africa (excluding high income)Middle East & North Africa (IDA & IBRD countries)Middle incomeMoldovaMongoliaMontenegroMoroccoMozambiqueMyanmarNamibiaNauruNepalNicaraguaNigerNigeriaOECD membersOther small statesPacific island small statesPakistanPalauPanamaPapua New GuineaParaguayPeruPhilippinesRwandaSao Tome and PrincipeSenegalSerbiaSierra LeoneSmall statesSolomon IslandsSomaliaSouth AfricaSouth AsiaSouth Asia (IDA & IBRD)South SudanSri LankaSt. LuciaSt. Vincent and the GrenadinesSub-Saharan Africa Sub-Saharan Africa (excluding high income)Sub-Saharan Africa (IDA & IBRD countries)SudanSurinameSyrian Arab RepublicTajikistanTanzaniaThailandTimor-LesteTogoTunisiaTurkeyTurkmenistanTuvaluUgandaUkraineUpper middle incomeUruguayUzbekistanVanuatuVenezuela, RBVietnamWest Bank and GazaWorldYemen, Rep.ZambiaZimbabwe

La ligne de temps

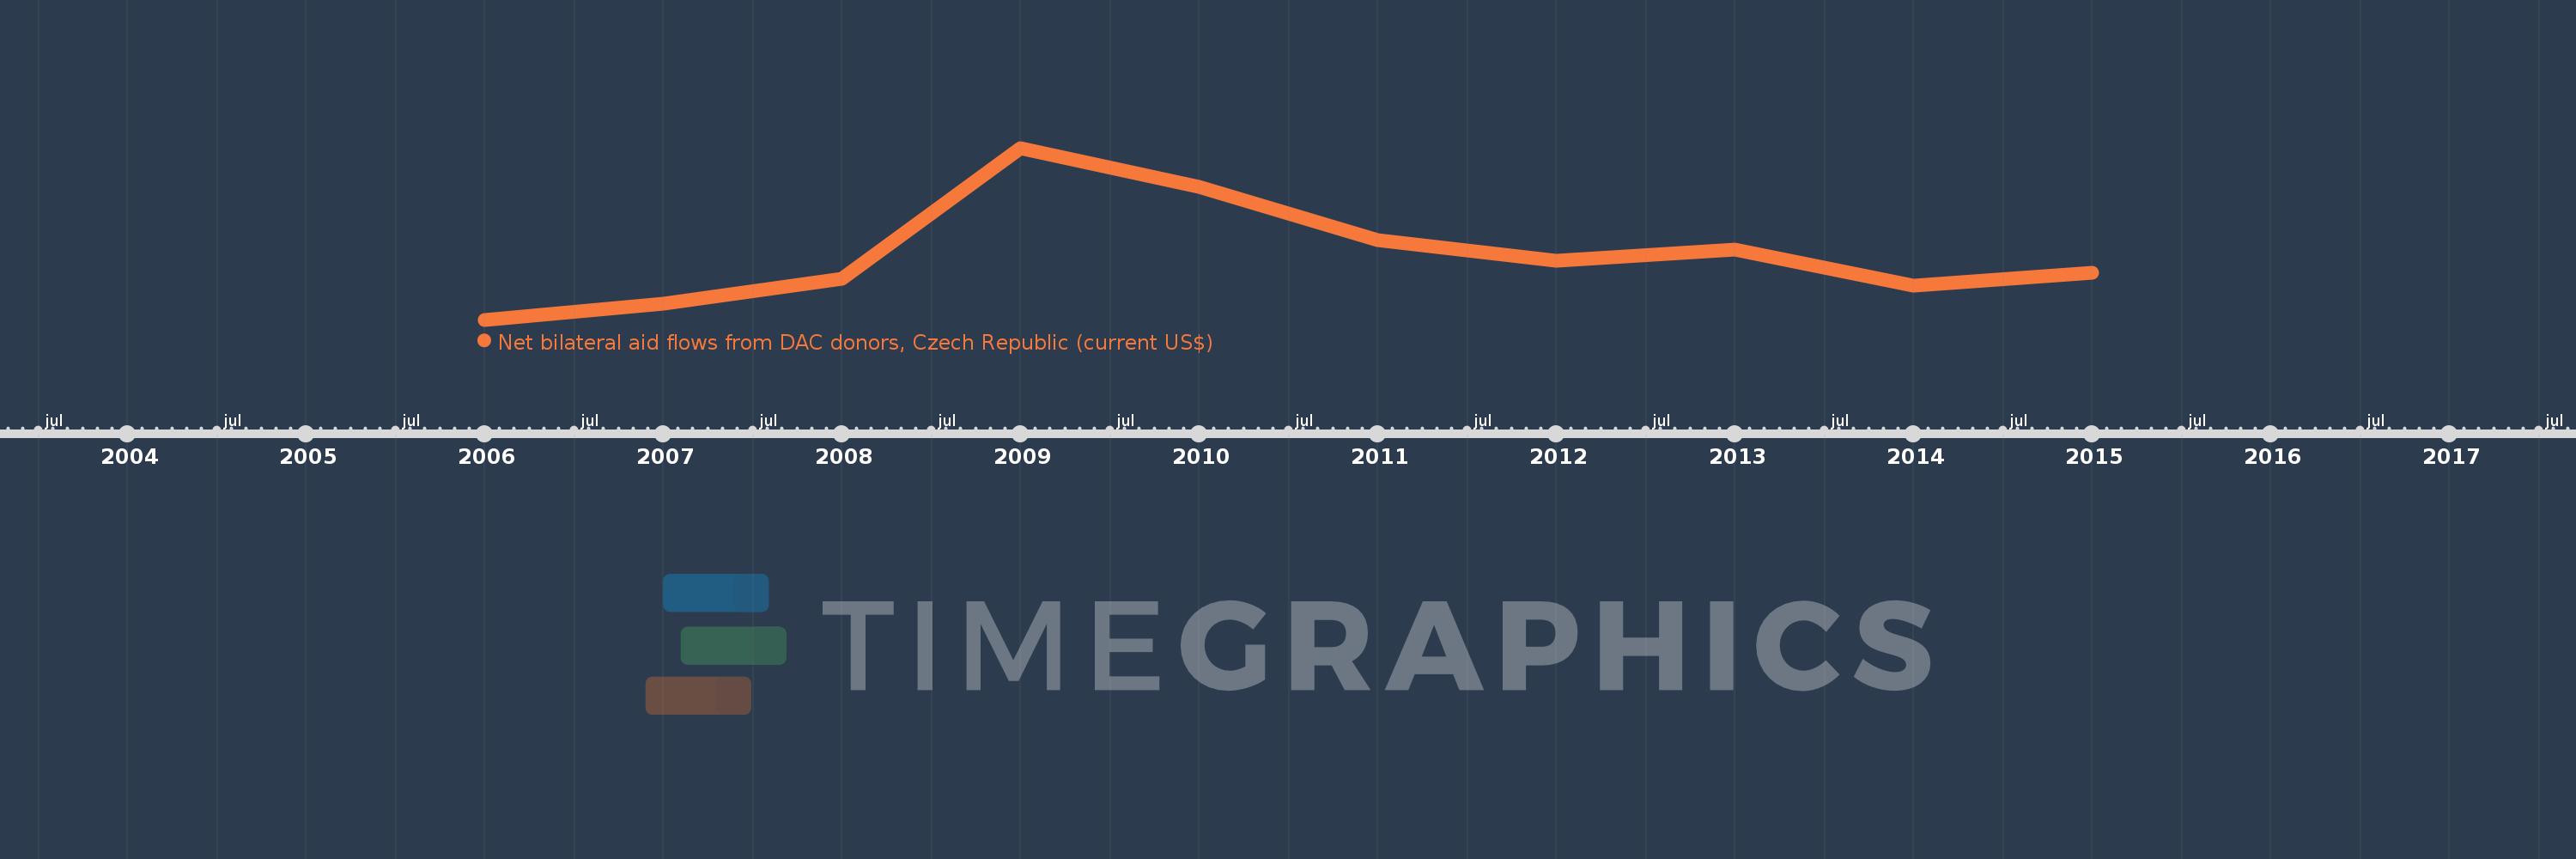
Cette échelle de temps montre un graphique de 2006 année à 2015 année IDA only. Les données jusqu'à 2005 année ne sont pas présentés. Quantité d'observations actuelles selon dates: 10.

Source (désignation):

Les indicateurs du développement mondiale

Source (organisation):

Development Assistance Committee of the Organisation for Economic Co-operation and Development, Geographical Distribution of Financial Flows to Developing Countries, Development Co-operation

Catégories:

Aid Effectiveness

Dernière mise à jour

23 avr. 2017

Les indicateurs de changement de valeurs selon les années

En moyenne:
23.943 mln.
Minimum:
6.1 mln.
1 janv. 2006
Maximum:
53.1 mln.
1 janv. 2009
Pour la date d''observation
Valeur
Changement absolu
Le changement par rapport à la valeur précédente
1 janv. 2006
6.1 mln.
+6.1 mln.
0.0%
1 janv. 2007
10.59 mln.
+4.49 mln.
73.61%
1 janv. 2008
17.3 mln.
+6.71 mln.
63.36%
1 janv. 2009
53.1 mln.
+35.8 mln.
206.94%
1 janv. 2010
42.54 mln.
-10.56 mln.
-19.89%
1 janv. 2011
27.95 mln.
-14.59 mln.
-34.3%
1 janv. 2012
22.18 mln.
-5.77 mln.
-20.64%
1 janv. 2013
25.36 mln.
+3.18 mln.
14.34%
1 janv. 2014
15.45 mln.
-9.91 mln.
-39.08%
1 janv. 2015
18.86 mln.
+3.41 mln.
22.07%

Classement des pays selon les statistiques actuelles par années