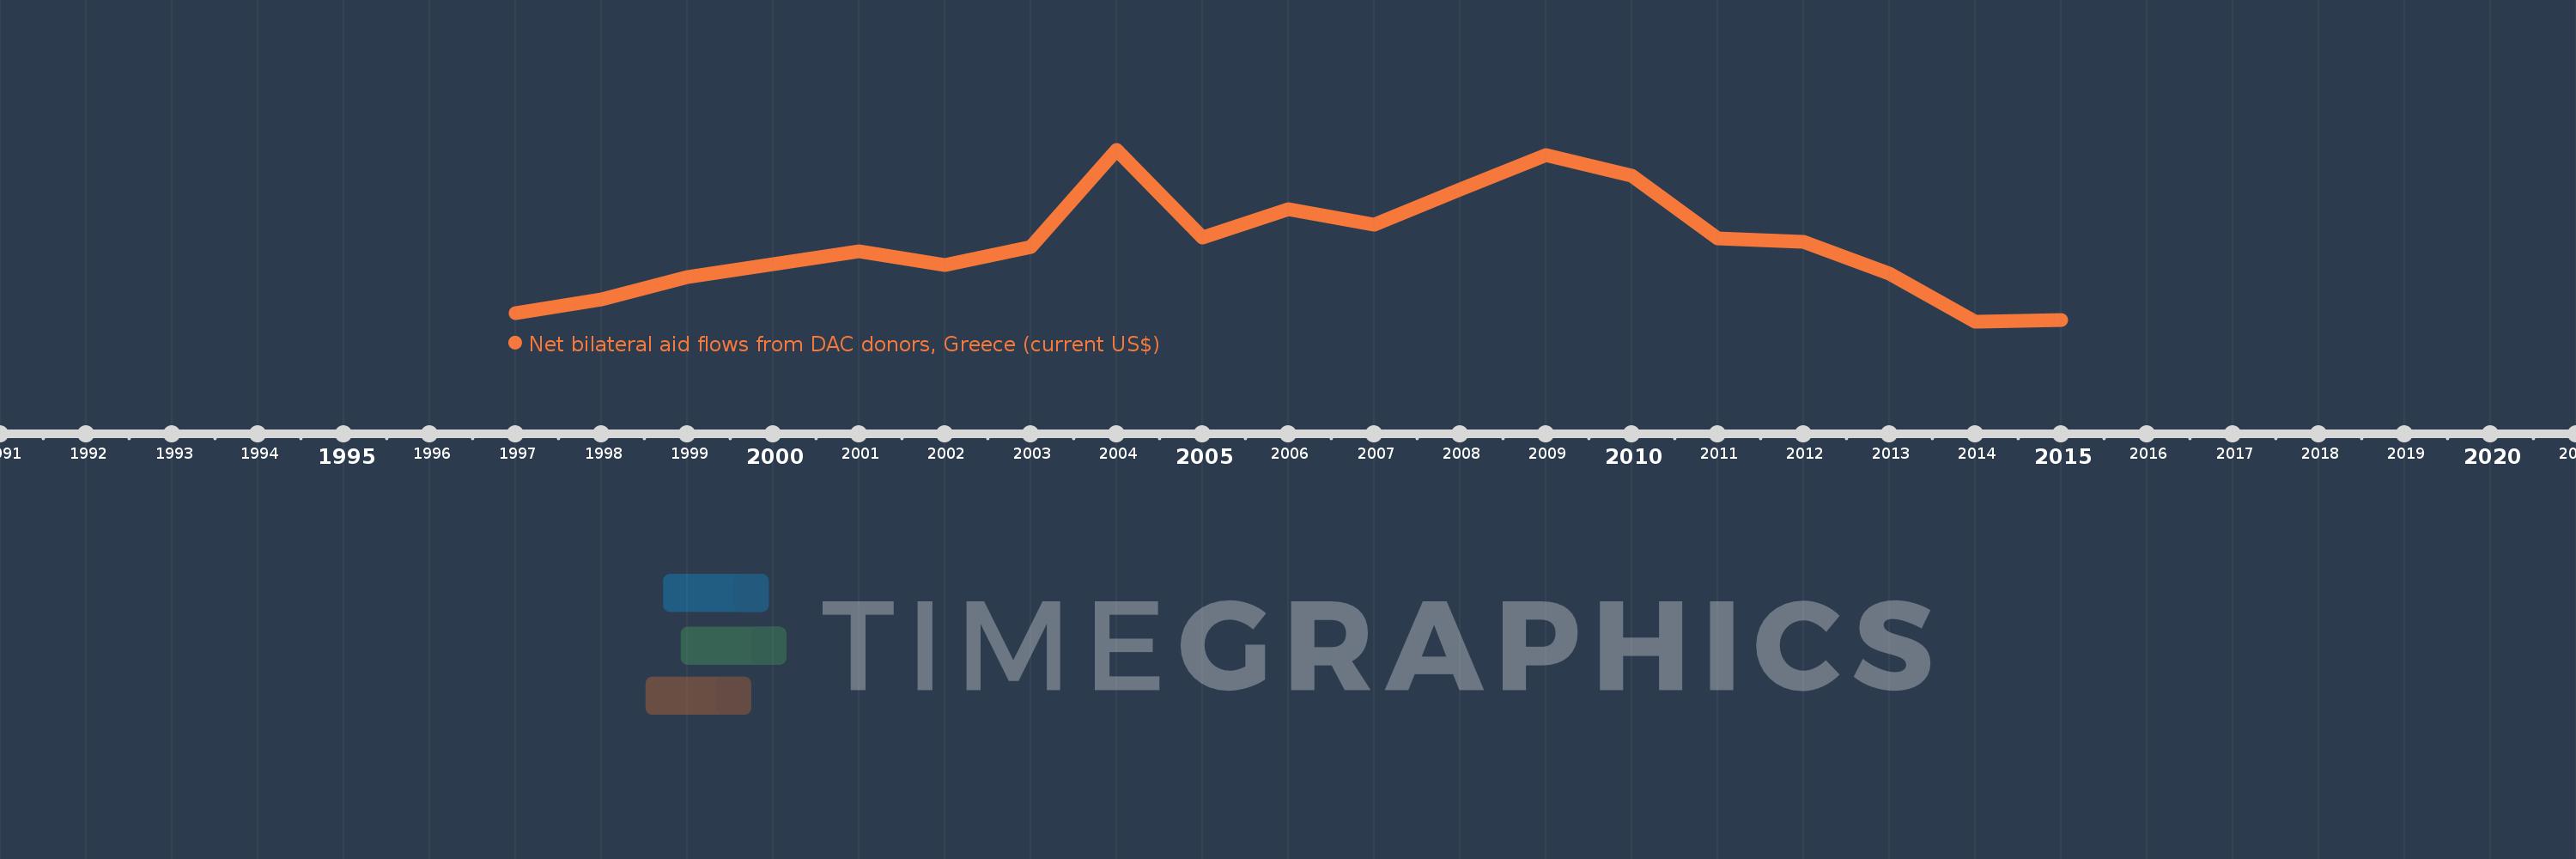
Cette échelle de temps montre un graphique de 1997 année à 2015 année IDA & IBRD total. Les données jusqu'à 1996 année ne sont pas présentés. Quantité d'observations actuelles selon dates: 19.
Source (désignation):
Les indicateurs du développement mondiale
Source (organisation):
Development Assistance Committee of the Organisation for Economic Co-operation and Development, Geographical Distribution of Financial Flows to Developing Countries, Development Co-operation Report, and International Development Statistics database. Data are available online at: www.oecd.org/dac/stats/idsonline.
Catégories:
Aid Effectiveness
Dernière mise à jour
23 avr. 2017
Les indicateurs de changement de valeurs selon les années
En moyenne:
104.661 mln.
Minimum:
13.02 mln.
1 janv. 2014
Maximum:
217.65 mln.
1 janv. 2004
Pour la date d''observation
Valeur
Changement absolu
Le changement par rapport à la valeur précédente
1 janv. 1997
23.85 mln.
+23.85 mln.
0.0%
1 janv. 1998
39.99 mln.
+16.14 mln.
67.67%
1 janv. 1999
66.42 mln.
+26.43 mln.
66.09%
1 janv. 2000
81.52 mln.
+15.1 mln.
22.73%
1 janv. 2001
96.81 mln.
+15.29 mln.
18.76%
1 janv. 2002
80.48 mln.
-16.33 mln.
-16.87%
1 janv. 2003
102.28 mln.
+21.8 mln.
27.09%
1 janv. 2004
217.65 mln.
+115.37 mln.
112.8%
1 janv. 2005
114.01 mln.
-103.64 mln.
-47.62%
1 janv. 2006
147.13 mln.
+33.12 mln.
29.05%
1 janv. 2007
128.85 mln.
-18.28 mln.
-12.42%
1 janv. 2008
170.46 mln.
+41.61 mln.
32.29%
1 janv. 2009
211.5 mln.
+41.04 mln.
24.08%
1 janv. 2010
187.48 mln.
-24.02 mln.
-11.36%
1 janv. 2011
112.93 mln.
-74.55 mln.
-39.76%
1 janv. 2012
108.89 mln.
-4.04 mln.
-3.58%
1 janv. 2013
70.38 mln.
-38.51 mln.
-35.37%
1 janv. 2014
13.02 mln.
-57.36 mln.
-81.5%
1 janv. 2015
14.9 mln.
+1.88 mln.
14.44%
Classement des pays selon les statistiques actuelles par années