29
/fr/
fr
AIzaSyAYiBZKx7MnpbEhh9jyipgxe19OcubqV5w
April 1, 2024
30826
Europe & Central Asia
ECS
false
2
1
Labor force with primary education, female (% of female labor force)
2015,2014,2013,2012,2011,2010,2009,2008,2007,2006,2005,2004,2003,1997,1996
Download
Bibliothèque de statistiques globales →Europe & Central Asia →

Labor force with primary education, female (% of female labor force)

Cette statistique dans les autres pays:
AlbaniaAlgeriaAntigua and BarbudaArgentinaArmeniaArubaAustraliaAustriaAzerbaijanBahamas, TheBahrainBarbadosBelarusBelgiumBelizeBermudaBoliviaBosnia and HerzegovinaBotswanaBrazilBritish Virgin IslandsBulgariaCanadaCayman IslandsCentral Europe and the BalticsChadChileColombiaCosta RicaCroatiaCubaCyprusCzech RepublicDenmarkDominicaDominican RepublicEcuadorEgypt, Arab Rep.El SalvadorEstoniaEthiopiaEuro areaEurope & Central AsiaEurope & Central Asia (excluding high income)Europe & Central Asia (IDA & IBRD countries)European UnionFinlandFranceGeorgiaGermanyGhanaGreeceGuatemalaGuyanaHigh incomeHondurasHong Kong SAR, ChinaHungaryIcelandIndiaIndonesiaIran, Islamic Rep.IrelandIsraelItalyJapanJordanKazakhstanKorea, Rep.KuwaitKyrgyz RepublicLatin America & Caribbean Latin America & Caribbean (excluding high income)Latin America & the Caribbean (IDA & IBRD countries)LatviaLebanonLithuaniaLuxembourgMacao SAR, ChinaMacedonia, FYRMadagascarMalaysiaMaltaMauritiusMexicoMoldovaMongoliaMontenegroMoroccoNamibiaNepalNetherlandsNew ZealandNicaraguaNigerNigeriaNorth AmericaNorwayOECD membersOmanPakistanPanamaParaguayPeruPhilippinesPolandPortugalPost-demographic dividendRomaniaRussian FederationRwandaSan MarinoSaudi ArabiaSerbiaSingaporeSlovak RepublicSloveniaSouth AfricaSouth AsiaSouth Asia (IDA & IBRD)SpainSri LankaSt. Kitts and NevisSt. LuciaSt. Vincent and the GrenadinesSwedenSwitzerlandSyrian Arab RepublicTajikistanThailandTimor-LesteTrinidad and TobagoTunisiaTurkeyUgandaUkraineUnited Arab EmiratesUnited KingdomUnited StatesUruguayVenezuela, RBWest Bank and GazaYemen, Rep.
La ligne de temps
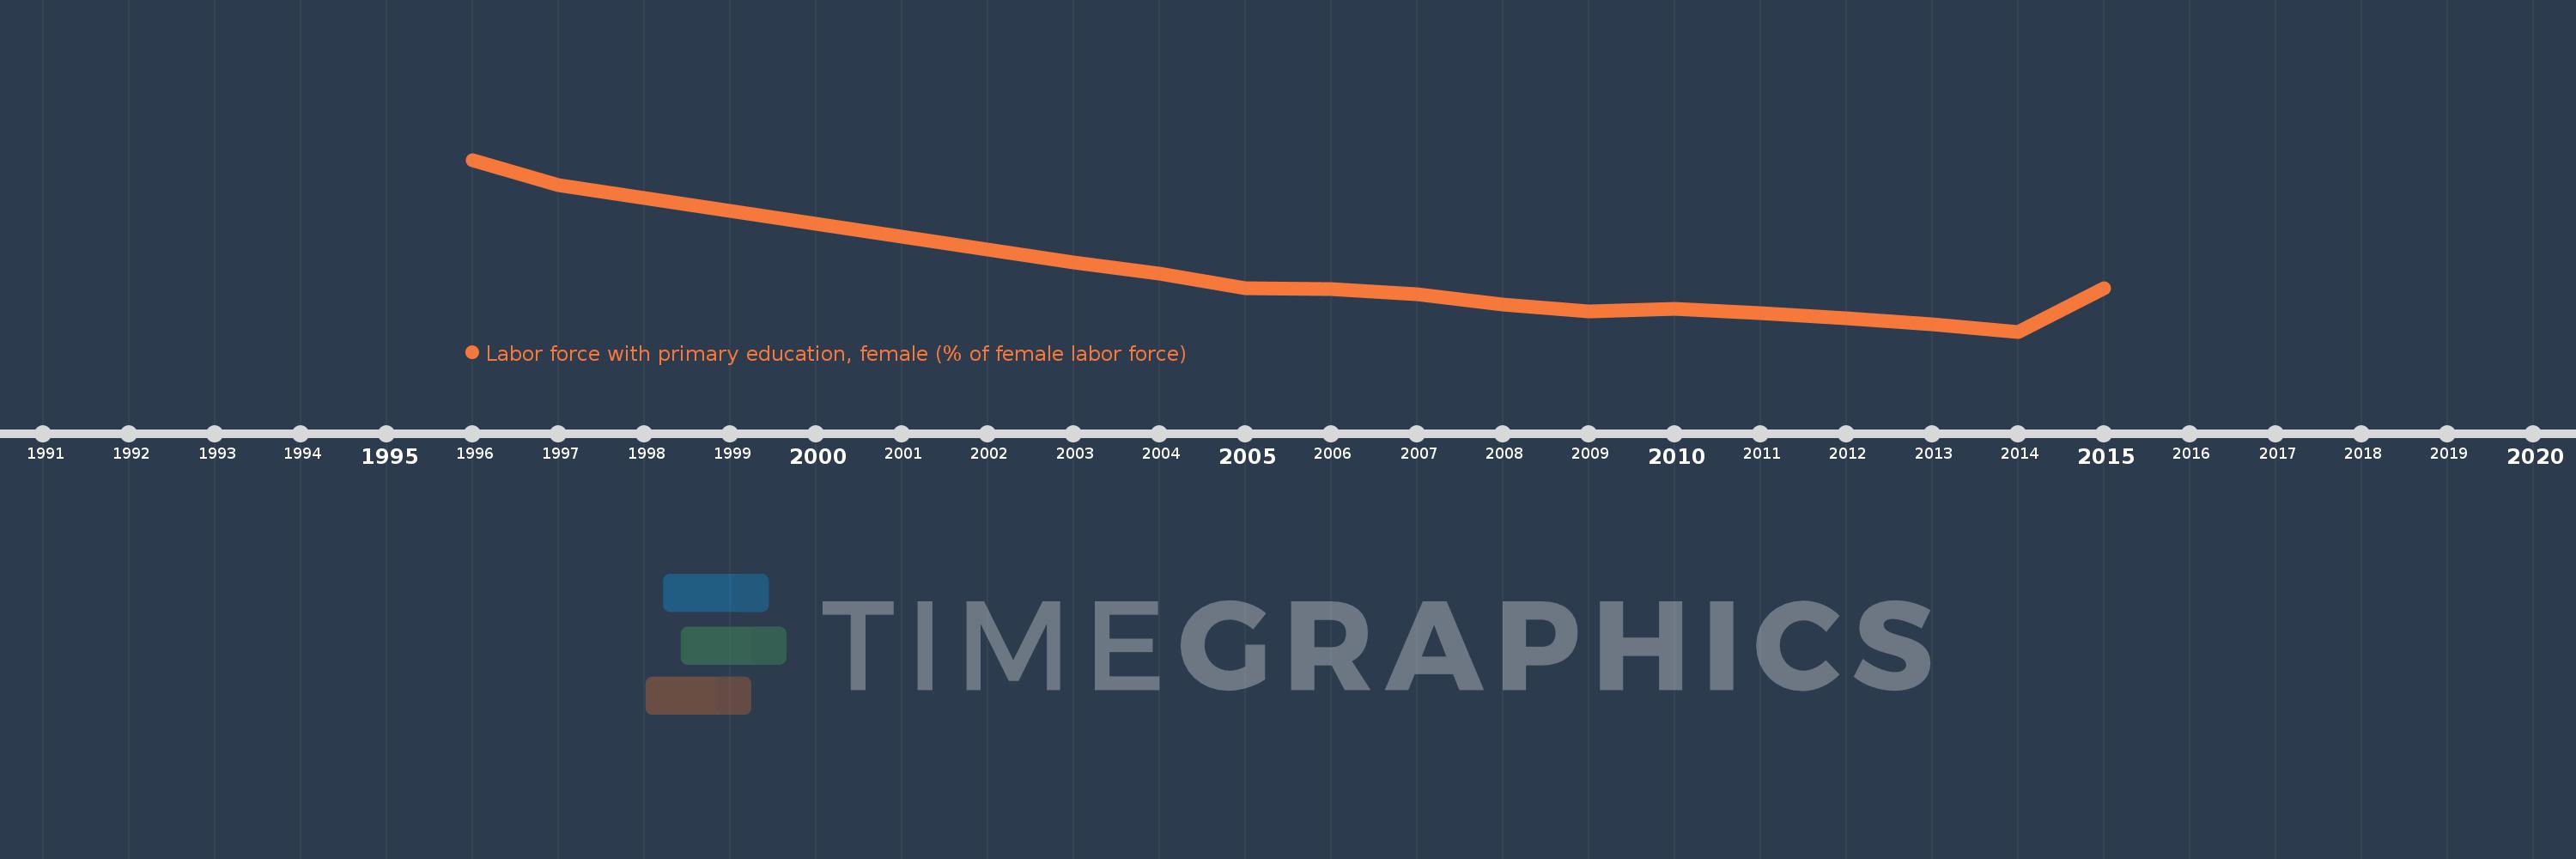
Cette échelle de temps montre un graphique de 1996 année à 2015 année Europe & Central Asia. Les données jusqu'à 1995 année ne sont pas présentés. Quantité d'observations actuelles selon dates: 15.
Source (désignation):
Les indicateurs du développement mondiale
Source (organisation):
International Labour Organization, Key Indicators of the Labour Market database.
Catégories:
Education, Social Protection & Labor, Gender
Dernière mise à jour
23 avr. 2017
Les indicateurs de changement de valeurs selon les années
En moyenne:
19.721
Minimum:
15.479
1 janv. 2014
Maximum:
30.633
1 janv. 1996
Pour la date d''observation
Valeur
Changement absolu
Le changement par rapport à la valeur précédente
1 janv. 1996
30.633
+30.633
0.0%
1 janv. 1997
28.411
-2.222
-7.25%
1 janv. 2003
21.591
-6.82
-24.0%
1 janv. 2004
20.596
-0.995
-4.61%
1 janv. 2005
19.324
-1.271
-6.17%
1 janv. 2006
19.231
-0.094
-0.48%
1 janv. 2007
18.756
-0.474
-2.47%
1 janv. 2008
17.844
-0.912
-4.86%
1 janv. 2009
17.277
-0.568
-3.18%
1 janv. 2010
17.475
+0.198
1.15%
1 janv. 2011
17.119
-0.356
-2.04%
1 janv. 2012
16.62
-0.499
-2.91%
1 janv. 2013
16.126
-0.494
-2.98%
1 janv. 2014
15.479
-0.647
-4.01%
1 janv. 2015
19.331
+3.852
24.89%
Classement des pays selon les statistiques actuelles par années

Commentaires:

Envoyer
PremiumAbout & FeedbackUn accordConfidentialité
logo
© 2022 Selected Technologies LLC – Morgan Hill, California