29
/fr/
fr
AIzaSyAYiBZKx7MnpbEhh9jyipgxe19OcubqV5w
April 1, 2024
30002
Euro area
EMU
false
2
1
Labor force with primary education (% of total)
2015,2014,2013,2012,2011,2010,2009,2008,2007,2006,2005,2004,2003,2002,2001,2000,1999,1998,1997,1996,1995,1994,1993
Download
Bibliothèque de statistiques globales →Euro area →

Labor force with primary education (% of total)

Cette statistique dans les autres pays:
AlbaniaAlgeriaAntigua and BarbudaArgentinaArmeniaArubaAustraliaAustriaAzerbaijanBahamas, TheBahrainBarbadosBelarusBelgiumBelizeBermudaBoliviaBosnia and HerzegovinaBotswanaBrazilBritish Virgin IslandsBulgariaCambodiaCanadaCayman IslandsCentral Europe and the BalticsChadChileColombiaCosta RicaCroatiaCubaCyprusCzech RepublicDenmarkDominicaDominican RepublicEarly-demographic dividendEcuadorEgypt, Arab Rep.El SalvadorEstoniaEthiopiaEuro areaEurope & Central AsiaEurope & Central Asia (excluding high income)Europe & Central Asia (IDA & IBRD countries)European UnionFinlandFranceFrench PolynesiaGeorgiaGermanyGhanaGreeceGuatemalaGuyanaHigh incomeHondurasHong Kong SAR, ChinaHungaryIcelandIndiaIndonesiaIran, Islamic Rep.IrelandIsraelItalyJapanJordanKazakhstanKorea, Rep.KosovoKuwaitKyrgyz RepublicLatin America & Caribbean Latin America & Caribbean (excluding high income)Latin America & the Caribbean (IDA & IBRD countries)LatviaLebanonLithuaniaLuxembourgMacao SAR, ChinaMacedonia, FYRMadagascarMalaysiaMaltaMauritiusMexicoMoldovaMongoliaMontenegroMoroccoNamibiaNepalNetherlandsNew CaledoniaNew ZealandNicaraguaNigerNigeriaNorth AmericaNorwayOECD membersOmanPakistanPanamaParaguayPeruPhilippinesPolandPortugalPost-demographic dividendRomaniaRussian FederationRwandaSan MarinoSaudi ArabiaSerbiaSingaporeSlovak RepublicSloveniaSouth AfricaSouth AsiaSouth Asia (IDA & IBRD)SpainSri LankaSt. Kitts and NevisSt. LuciaSt. Vincent and the GrenadinesSwedenSwitzerlandSyrian Arab RepublicTajikistanThailandTimor-LesteTrinidad and TobagoTunisiaTurkeyUgandaUkraineUnited Arab EmiratesUnited KingdomUnited StatesUruguayVenezuela, RBWest Bank and GazaYemen, Rep.
La ligne de temps
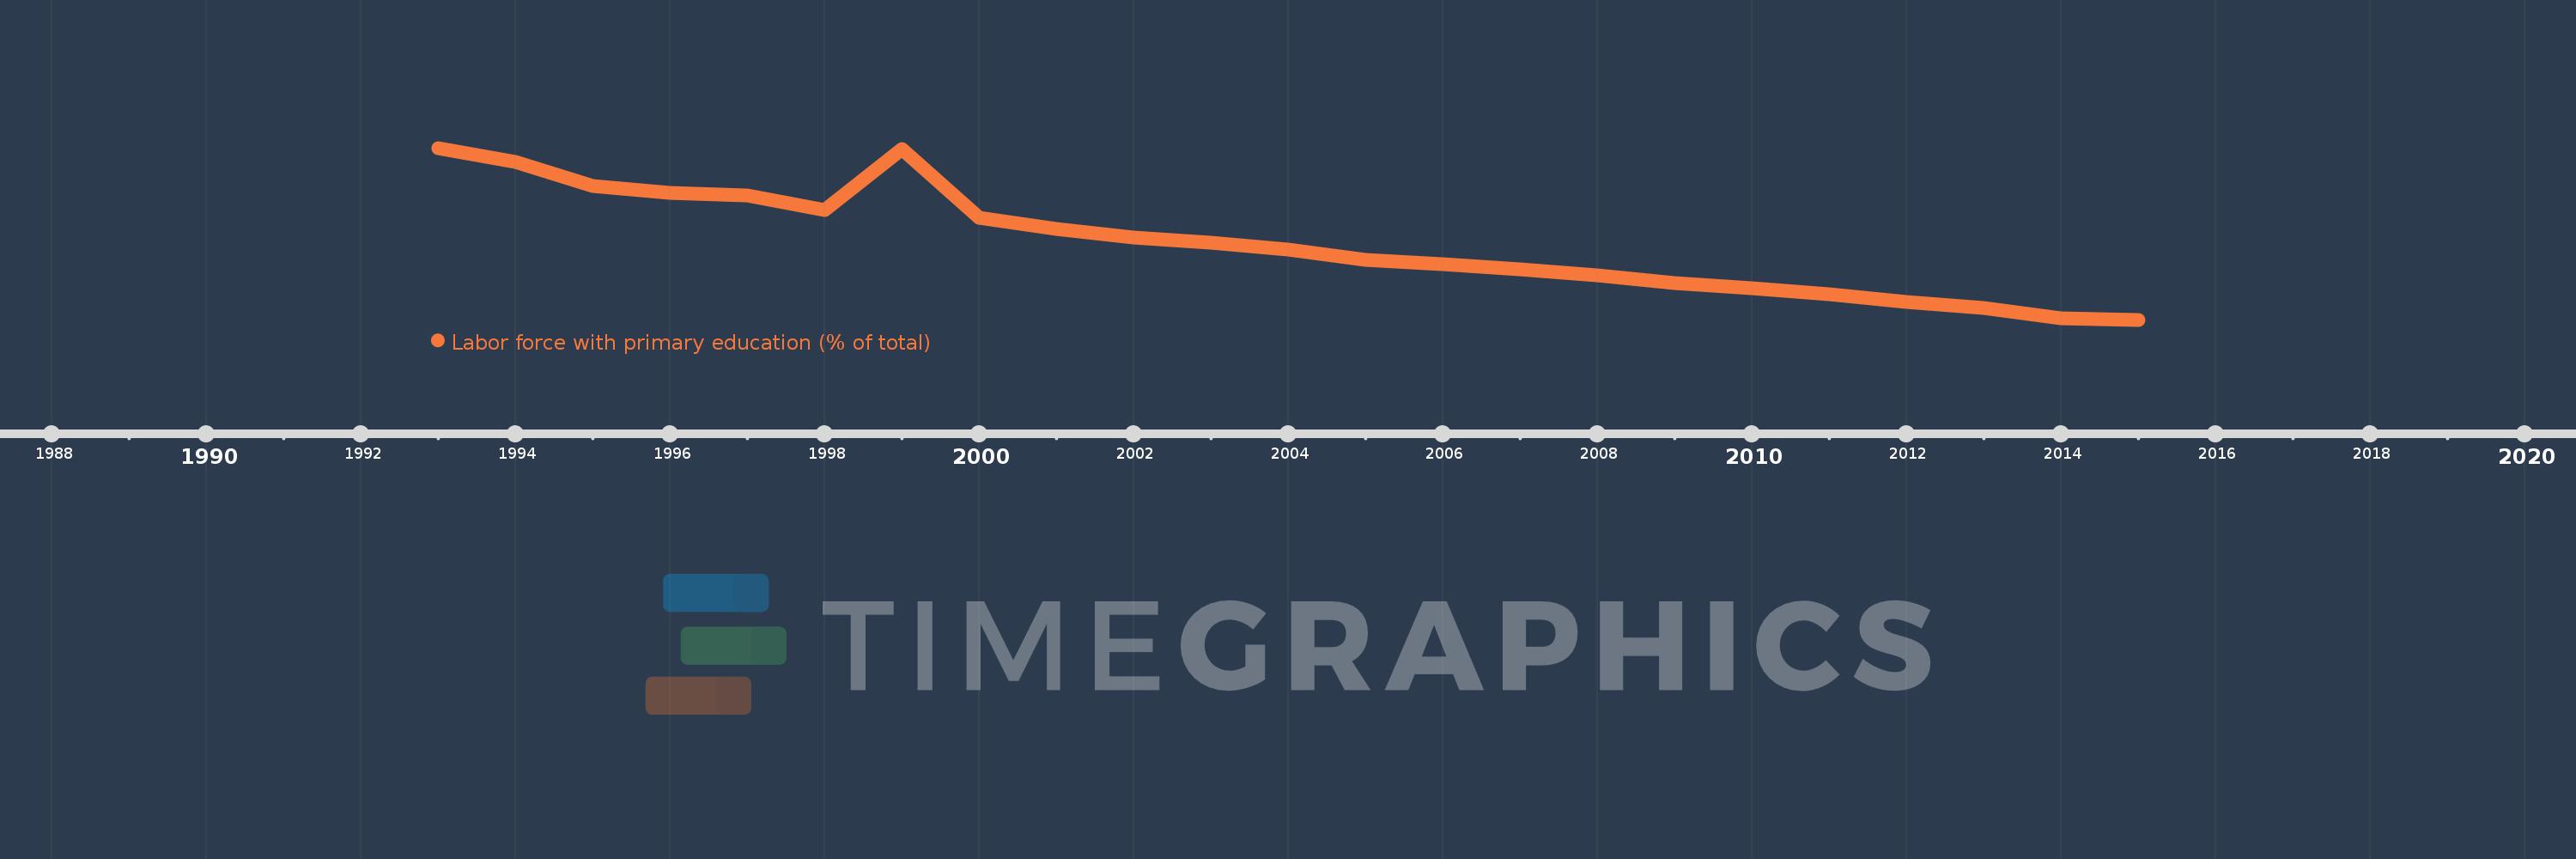
Cette échelle de temps montre un graphique de 1993 année à 2015 année Euro area. Les données jusqu'à 1992 année ne sont pas présentés. Quantité d'observations actuelles selon dates: 23.
Source (désignation):
Les indicateurs du développement mondiale
Source (organisation):
International Labour Organization, Key Indicators of the Labour Market database.
Catégories:
Education, Social Protection & Labor
Dernière mise à jour
23 avr. 2017
Les indicateurs de changement de valeurs selon les années
En moyenne:
31.741
Minimum:
23.399
1 janv. 2015
Maximum:
42.224
1 janv. 1993
Pour la date d''observation
Valeur
Changement absolu
Le changement par rapport à la valeur précédente
1 janv. 1993
42.224
+42.224
0.0%
1 janv. 1994
40.648
-1.576
-3.73%
1 janv. 1995
38.055
-2.593
-6.38%
1 janv. 1996
37.302
-0.753
-1.98%
1 janv. 1997
36.978
-0.324
-0.87%
1 janv. 1998
35.439
-1.538
-4.16%
1 janv. 1999
42.102
+6.663
18.8%
1 janv. 2000
34.54
-7.562
-17.96%
1 janv. 2001
33.348
-1.193
-3.45%
1 janv. 2002
32.369
-0.979
-2.94%
1 janv. 2003
31.836
-0.533
-1.65%
1 janv. 2004
31.073
-0.763
-2.4%
1 janv. 2005
29.985
-1.089
-3.5%
1 janv. 2006
29.443
-0.542
-1.81%
1 janv. 2007
28.96
-0.483
-1.64%
1 janv. 2008
28.22
-0.74
-2.56%
1 janv. 2009
27.437
-0.783
-2.77%
1 janv. 2010
26.825
-0.612
-2.23%
1 janv. 2011
26.209
-0.616
-2.3%
1 janv. 2012
25.316
-0.893
-3.41%
1 janv. 2013
24.728
-0.589
-2.33%
1 janv. 2014
23.605
-1.123
-4.54%
1 janv. 2015
23.399
-0.206
-0.87%
Classement des pays selon les statistiques actuelles par années

Commentaires:

Envoyer
PremiumAbout & FeedbackUn accordConfidentialité
logo
© 2022 Selected Technologies LLC – Morgan Hill, California