33
/fr/
AIzaSyB4mHJ5NPEv-XzF7P6NDYXjlkCWaeKw5bc
November 1, 2025
286626
Zambia
ZMB
true
2
1
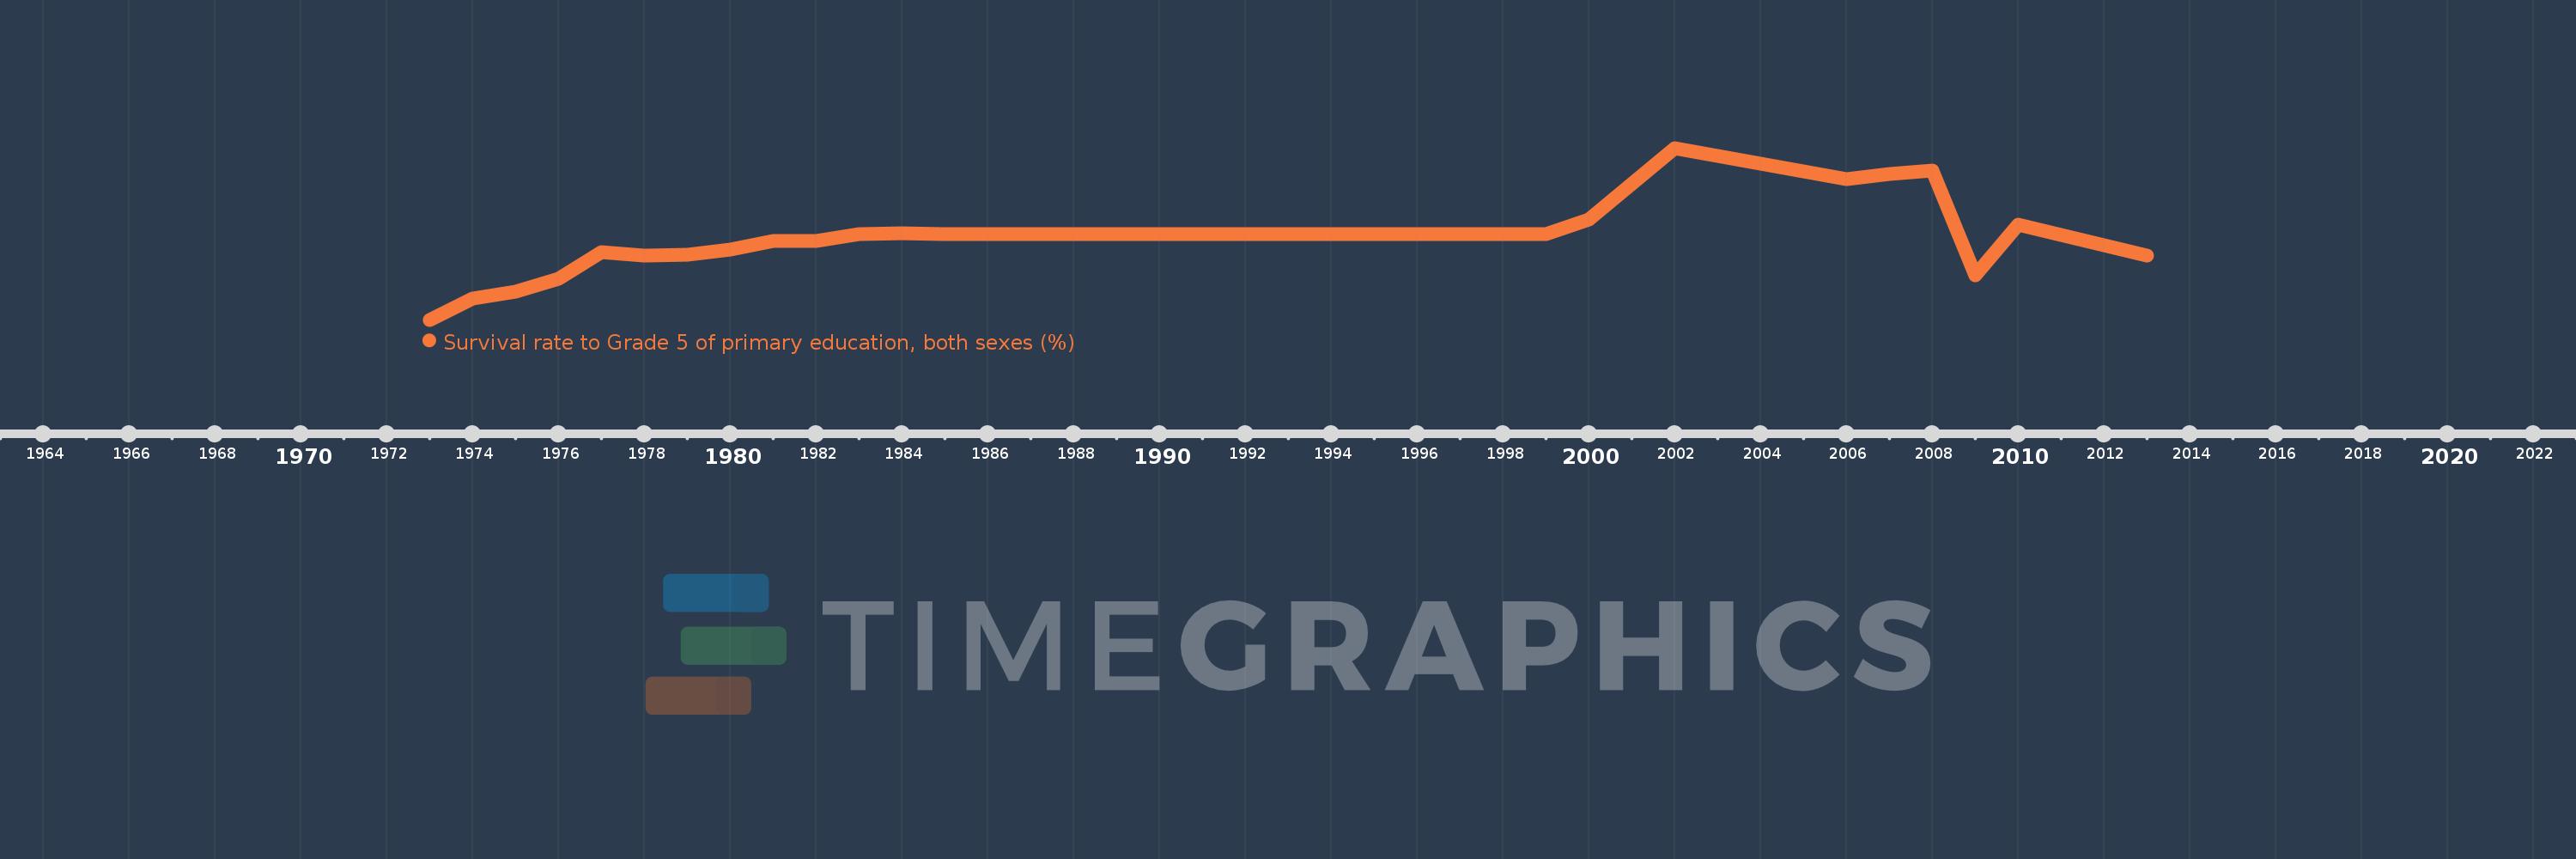
Survival rate to Grade 5 of primary education, both sexes (%)
2013,2010,2009,2008,2007,2006,2002,2000,1999,1985,1984,1983,1982,1981,1980,1979,1978,1977,1976,1975,1974,1973