29
/fr/
fr
AIzaSyAYiBZKx7MnpbEhh9jyipgxe19OcubqV5w
April 1, 2024
283900
West Bank and Gaza
PSE
true
2
1
Net errors and omissions (BoP, current US$)
2016,2015,2014,2013,2012,2011,2010,2009,2008,2007,2006,2005,2004,2003,2002,2001,2000,1999,1998,1997,1996
Download
Bibliothèque de statistiques globales →West Bank and Gaza →

Net errors and omissions (BoP, current US$)

Cette statistique dans les autres pays:
AfghanistanAlbaniaAlgeriaAngolaAntigua and BarbudaArgentinaArmeniaArubaAustraliaAustriaAzerbaijanBahamas, TheBahrainBangladeshBarbadosBelarusBelgiumBelizeBeninBermudaBhutanBoliviaBosnia and HerzegovinaBotswanaBrazilBrunei DarussalamBulgariaBurkina FasoBurundiCabo VerdeCambodiaCameroonCanadaCentral African RepublicChadChileChinaColombiaComorosCongo, Dem. Rep.Congo, Rep.Costa RicaCote d'IvoireCroatiaCuracaoCyprusCzech RepublicDenmarkDjiboutiDominicaDominican RepublicEcuadorEgypt, Arab Rep.El SalvadorEquatorial GuineaEritreaEstoniaEthiopiaEuro areaFijiFinlandFranceFrench PolynesiaGabonGambia, TheGeorgiaGermanyGhanaGreeceGrenadaGuatemalaGuineaGuinea-BissauGuyanaHaitiHondurasHong Kong SAR, ChinaHungaryIcelandIndiaIndonesiaIran, Islamic Rep.IraqIrelandIsraelItalyJamaicaJapanJordanKazakhstanKenyaKiribatiKorea, Rep.KosovoKuwaitKyrgyz RepublicLao PDRLatviaLebanonLesothoLiberiaLibyaLithuaniaLuxembourgMacao SAR, ChinaMacedonia, FYRMadagascarMalawiMalaysiaMaldivesMaliMaltaMarshall IslandsMauritaniaMauritiusMexicoMicronesia, Fed. Sts.MoldovaMongoliaMontenegroMoroccoMozambiqueMyanmarNamibiaNepalNetherlandsNew CaledoniaNew ZealandNicaraguaNigerNigeriaNorwayOmanPakistanPalauPanamaPapua New GuineaParaguayPeruPhilippinesPolandPortugalQatarRomaniaRussian FederationRwandaSamoaSao Tome and PrincipeSaudi ArabiaSenegalSerbiaSeychellesSierra LeoneSingaporeSint Maarten (Dutch part)Slovak RepublicSloveniaSolomon IslandsSouth AfricaSouth SudanSpainSri LankaSt. Kitts and NevisSt. LuciaSt. Vincent and the GrenadinesSudanSurinameSwazilandSwedenSwitzerlandSyrian Arab RepublicTajikistanTanzaniaThailandTimor-LesteTogoTongaTrinidad and TobagoTunisiaTurkeyTuvaluUgandaUkraineUnited KingdomUnited StatesUruguayVanuatuVenezuela, RBVietnamWest Bank and GazaYemen, Rep.ZambiaZimbabwe
La ligne de temps
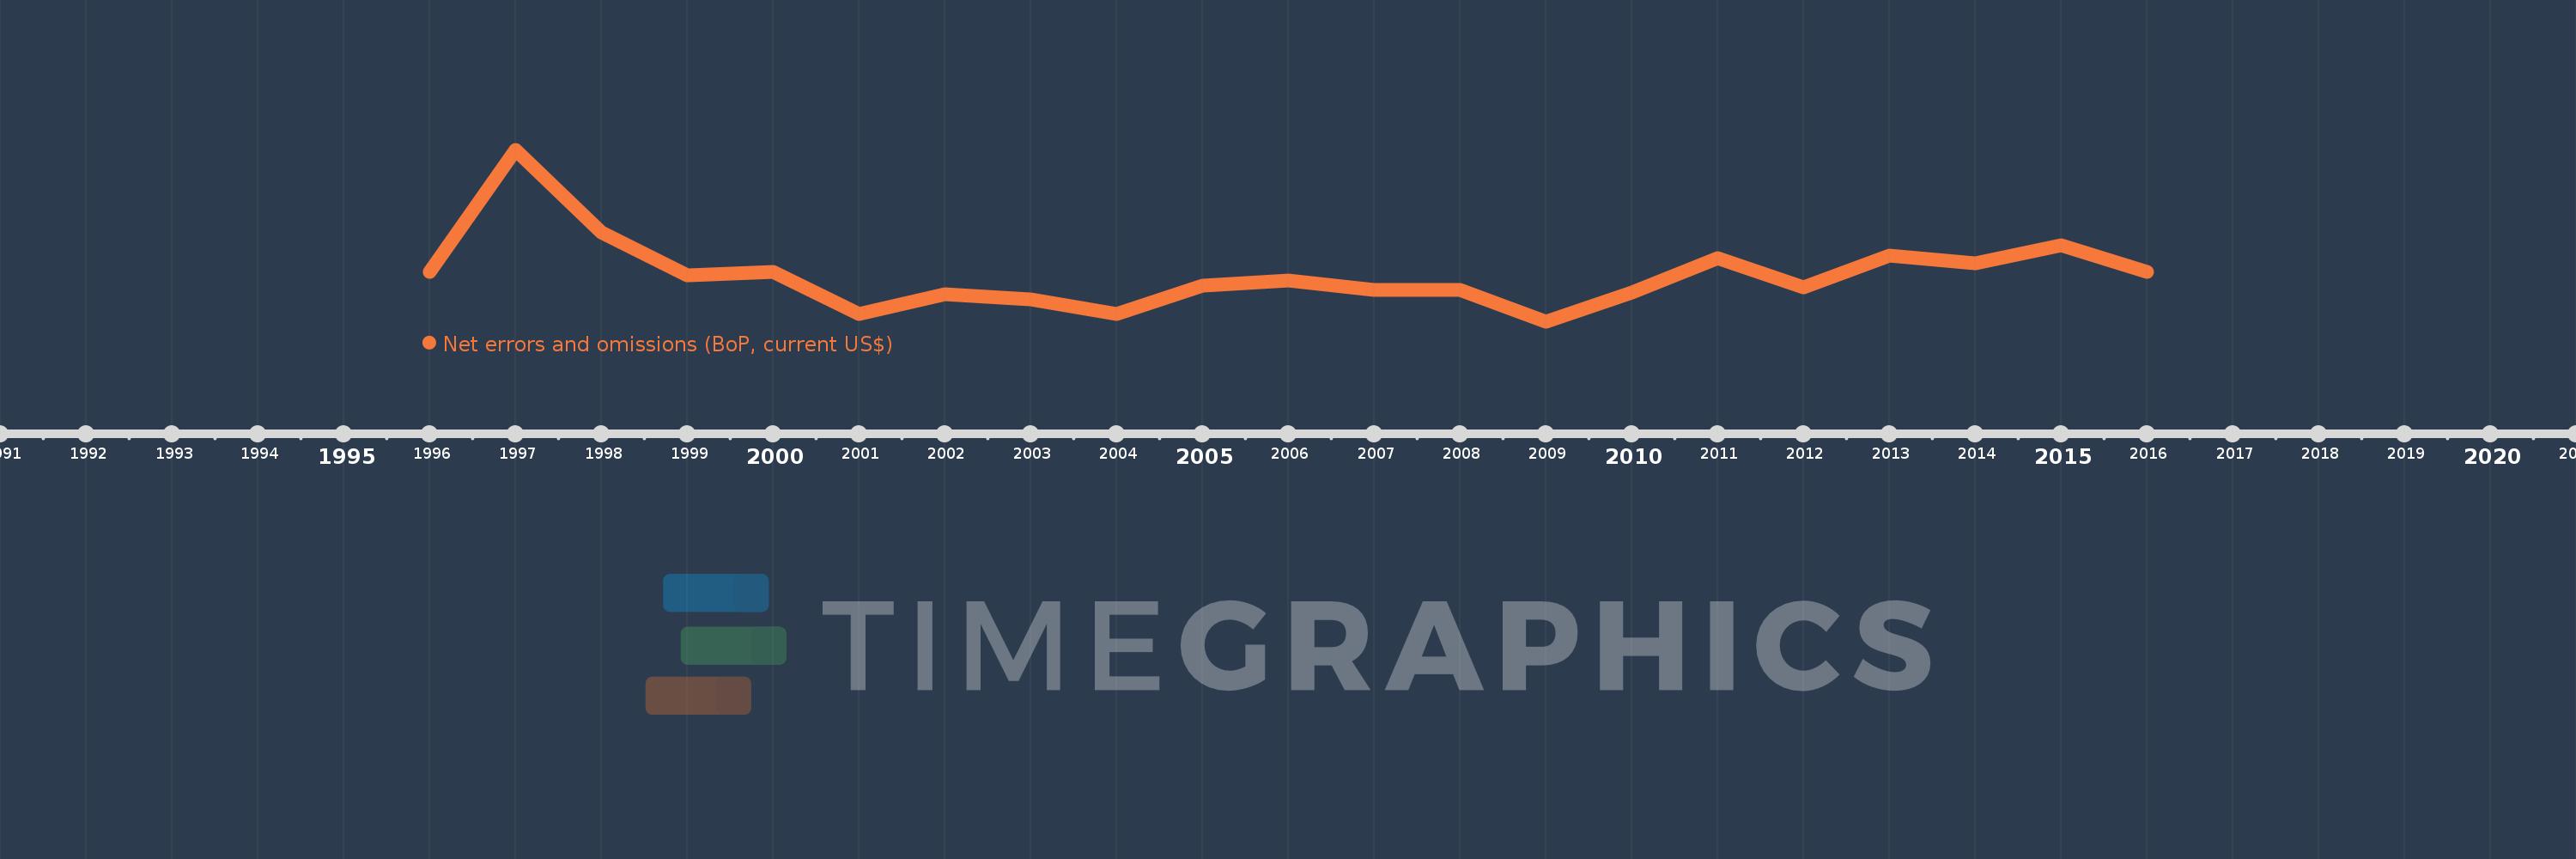
Cette échelle de temps montre un graphique de 1996 année à 2016 année West Bank and Gaza. Les données jusqu'à 1995 année ne sont pas présentés. Quantité d'observations actuelles selon dates: 21.
Source (désignation):
Les indicateurs du développement mondiale
Source (organisation):
International Monetary Fund, Balance of Payments Statistics Yearbook and data files.
Catégories:
Economy & Growth
Dernière mise à jour
23 avr. 2017
Les indicateurs de changement de valeurs selon les années
En moyenne:
142.705 mln.
Minimum:
-250.011 mln.
1 janv. 2009
Maximum:
1.176 mds
1 janv. 1997
Pour la date d''observation
Valeur
Changement absolu
Le changement par rapport à la valeur précédente
1 janv. 1996
164.3 mln.
+164.3 mln.
0.0%
1 janv. 1997
1.176 mds
+1.011 mds
615.58%
1 janv. 1998
490.645 mln.
-685.055 mln.
-58.27%
1 janv. 1999
134.303 mln.
-356.342 mln.
-72.63%
1 janv. 2000
165.909 mln.
+31.606 mln.
23.53%
1 janv. 2001
-182.06 mln.
-347.969 mln.
-209.73%
1 janv. 2002
-20.626 mln.
+161.434 mln.
-88.67%
1 janv. 2003
-63.232 mln.
-42.606 mln.
206.57%
1 janv. 2004
-184.072 mln.
-120.84 mln.
191.11%
1 janv. 2005
51.157 mln.
+235.23 mln.
-127.79%
1 janv. 2006
94.404 mln.
+43.247 mln.
84.54%
1 janv. 2007
13.07 mln.
-81.335 mln.
-86.16%
1 janv. 2008
17.053 mln.
+3.984 mln.
30.48%
1 janv. 2009
-250.011 mln.
-267.064 mln.
-1.57 milles%
1 janv. 2010
-5.796 mln.
+244.215 mln.
-97.68%
1 janv. 2011
277.337 mln.
+283.133 mln.
-4.88 milles%
1 janv. 2012
33.939 mln.
-243.398 mln.
-87.76%
1 janv. 2013
298.482 mln.
+264.543 mln.
779.47%
1 janv. 2014
239.079 mln.
-59.403 mln.
-19.9%
1 janv. 2015
383.258 mln.
+144.178 mln.
60.31%
1 janv. 2016
163.96 mln.
-219.297 mln.
-57.22%
Classement des pays selon les statistiques actuelles par années

Commentaires:

Envoyer
PremiumAbout & FeedbackUn accordConfidentialité
logo
© 2022 Selected Technologies LLC – Morgan Hill, California