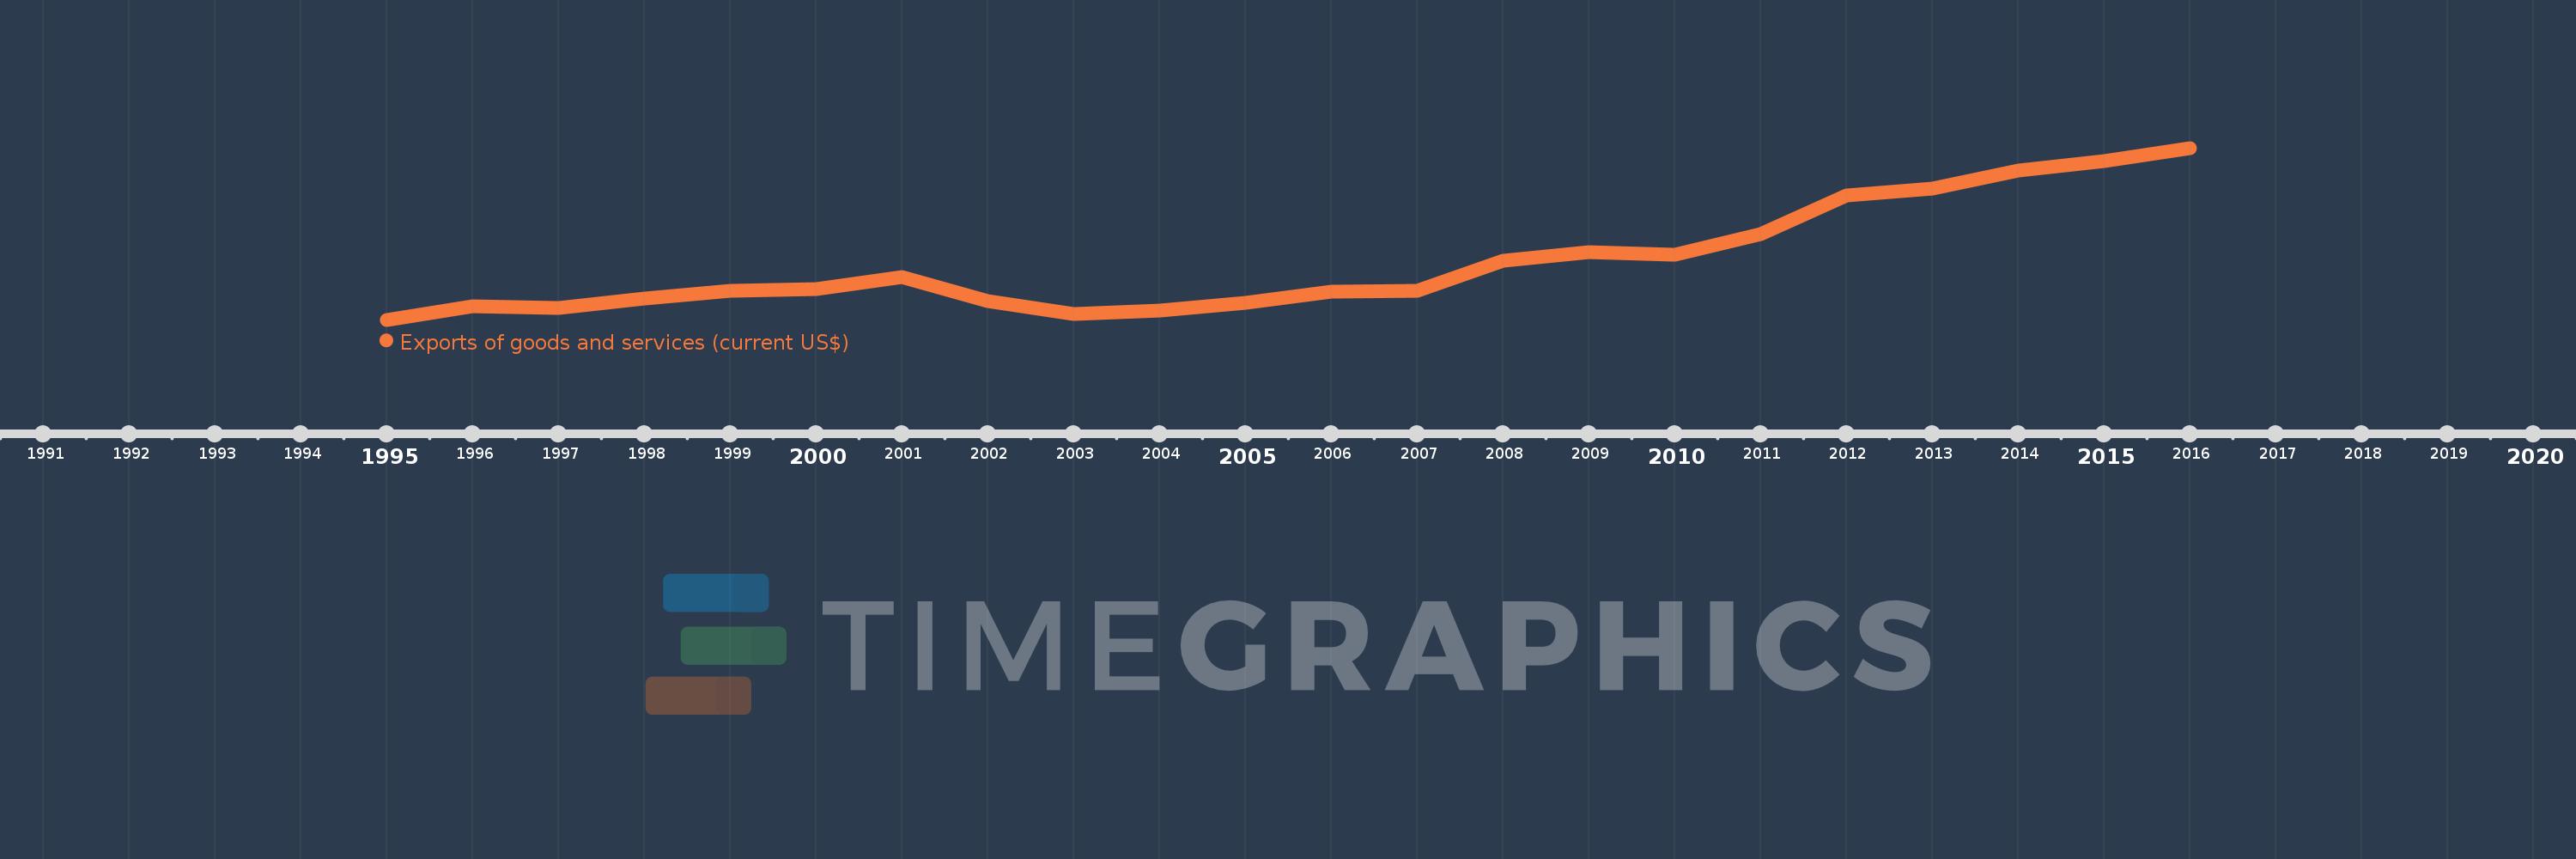
Cette échelle de temps montre un graphique de 1995 année à 2016 année West Bank and Gaza. Les données jusqu'à 1994 année ne sont pas présentés. Quantité d'observations actuelles selon dates: 22.
Source (désignation):
Les indicateurs du développement mondiale
Source (organisation):
World Bank national accounts data, and OECD National Accounts data files.
Catégories:
Economy & Growth, Trade
Dernière mise à jour
23 avr. 2017
Les indicateurs de changement de valeurs selon les années
En moyenne:
1.053 mds
Minimum:
413.5 mln.
1 janv. 1995
Maximum:
2.323 mds
1 janv. 2016
Pour la date d''observation
Valeur
Changement absolu
Le changement par rapport à la valeur précédente
1 janv. 1995
413.5 mln.
+413.5 mln.
0.0%
1 janv. 1996
562.1 mln.
+148.6 mln.
35.94%
1 janv. 1997
546.0 mln.
-16.1 mln.
-2.86%
1 janv. 1998
650.3 mln.
+104.3 mln.
19.1%
1 janv. 1999
734.4 mln.
+84.1 mln.
12.93%
1 janv. 2000
751.6 mln.
+17.2 mln.
2.34%
1 janv. 2001
885.0 mln.
+133.4 mln.
17.75%
1 janv. 2002
615.9 mln.
-269.1 mln.
-30.41%
1 janv. 2003
477.8 mln.
-138.1 mln.
-22.42%
1 janv. 2004
515.1 mln.
+37.3 mln.
7.81%
1 janv. 2005
596.8 mln.
+81.7 mln.
15.86%
1 janv. 2006
723.3 mln.
+126.5 mln.
21.2%
1 janv. 2007
736.3 mln.
+13.0 mln.
1.8%
1 janv. 2008
1.066 mds
+330.0 mln.
44.82%
1 janv. 2009
1.165 mds
+98.7 mln.
9.26%
1 janv. 2010
1.133 mds
-31.7 mln.
-2.72%
1 janv. 2011
1.367 mds
+234.0 mln.
20.65%
1 janv. 2012
1.798 mds
+431.145 mln.
31.53%
1 janv. 2013
1.871 mds
+72.655 mln.
4.04%
1 janv. 2014
2.072 mds
+200.7 mln.
10.73%
1 janv. 2015
2.172 mds
+100.5 mln.
4.85%
1 janv. 2016
2.323 mds
+150.4 mln.
6.92%
Classement des pays selon les statistiques actuelles par années