29
/fr/
fr
AIzaSyAYiBZKx7MnpbEhh9jyipgxe19OcubqV5w
April 1, 2024
281705
Venezuela, RB
VEN
true
2
1
Stocks traded, turnover ratio of domestic shares (%)
2003,2002,2001,2000,1999,1998,1997,1996,1995,1994
Download
Bibliothèque de statistiques globales →Venezuela, RB →

Stocks traded, turnover ratio of domestic shares (%)

Cette statistique dans les autres pays:
Arab WorldArgentinaArmeniaAustraliaAustriaBahrainBangladeshBarbadosBelgiumBermudaBoliviaBotswanaBrazilBulgariaCanadaCaribbean small statesCayman IslandsCentral Europe and the BalticsChannel IslandsChileChinaColombiaCosta RicaCote d'IvoireCroatiaCyprusCzech RepublicDenmarkEarly-demographic dividendEast Asia & PacificEast Asia & Pacific (excluding high income)East Asia & Pacific (IDA & IBRD countries)EcuadorEgypt, Arab Rep.El SalvadorEuro areaEurope & Central AsiaEurope & Central Asia (excluding high income)Europe & Central Asia (IDA & IBRD countries)European UnionFijiFinlandFragile and conflict affected situationsFranceGeorgiaGermanyGhanaGreeceGuyanaHeavily indebted poor countries (HIPC)High incomeHong Kong SAR, ChinaHungaryIBRD onlyIDA & IBRD totalIDA blendIDA onlyIDA totalIndiaIndonesiaIran, Islamic Rep.IrelandIsraelItalyJamaicaJapanJordanKazakhstanKenyaKorea, Rep.KuwaitKyrgyz RepublicLate-demographic dividendLatin America & Caribbean Latin America & Caribbean (excluding high income)Latin America & the Caribbean (IDA & IBRD countries)Least developed countries: UN classificationLebanonLow & middle incomeLow incomeLower middle incomeLuxembourgMacedonia, FYRMalawiMalaysiaMaltaMauritiusMexicoMiddle East & North AfricaMiddle East & North Africa (excluding high income)Middle East & North Africa (IDA & IBRD countries)Middle incomeMoldovaMongoliaMontenegroMoroccoNamibiaNetherlandsNew ZealandNigeriaNorth AmericaNorwayOECD membersOmanOther small statesPacific island small statesPakistanPanamaPapua New GuineaParaguayPeruPhilippinesPolandPortugalPost-demographic dividendPre-demographic dividendQatarRomaniaRussian FederationSaudi ArabiaSerbiaSingaporeSlovak RepublicSloveniaSmall statesSouth AfricaSouth AsiaSouth Asia (IDA & IBRD)SpainSri LankaSt. Kitts and NevisSub-Saharan Africa Sub-Saharan Africa (excluding high income)Sub-Saharan Africa (IDA & IBRD countries)SwazilandSwedenSwitzerlandTanzaniaThailandTrinidad and TobagoTunisiaTurkeyUgandaUkraineUnited Arab EmiratesUnited KingdomUnited StatesUpper middle incomeUruguayUzbekistanVenezuela, RBVietnamWest Bank and GazaWorldZambiaZimbabwe
La ligne de temps
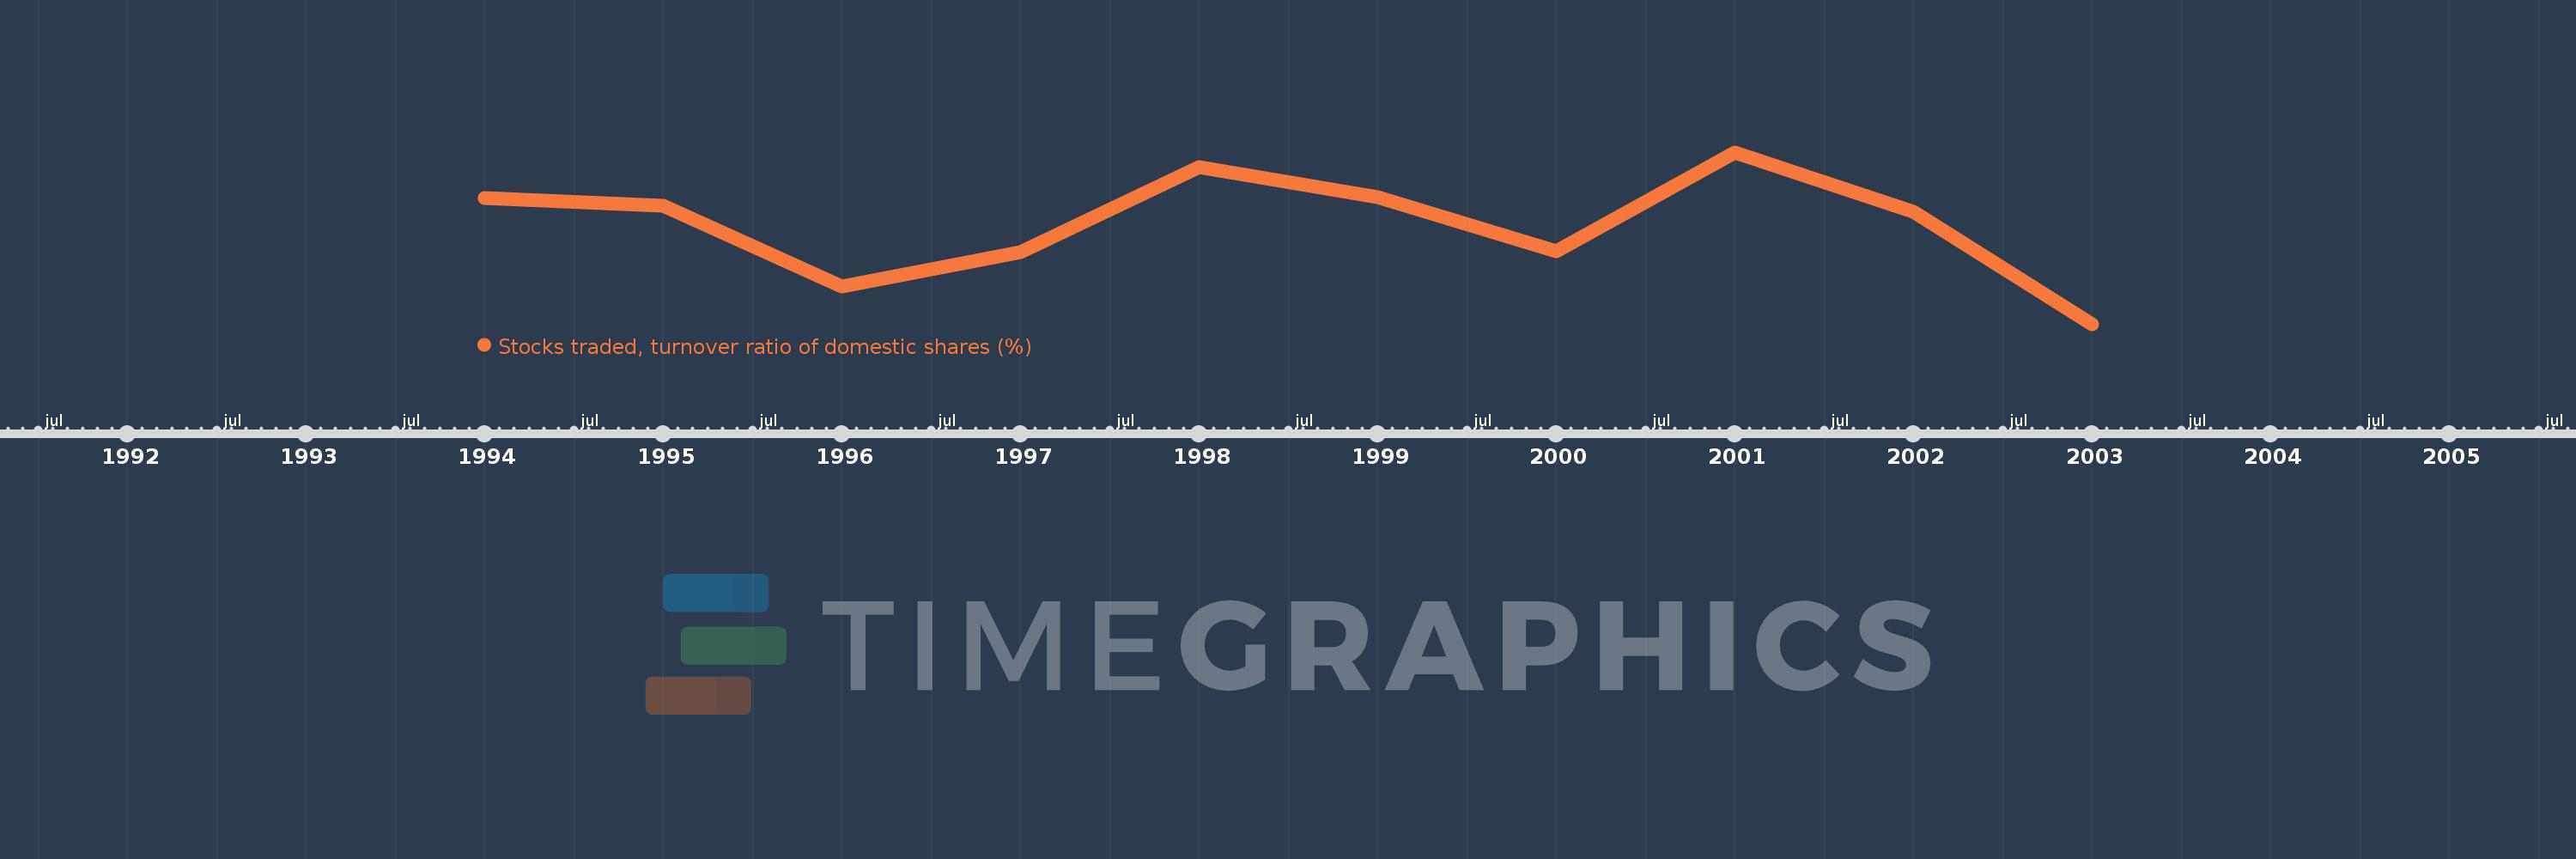
Cette échelle de temps montre un graphique de 1994 année à 2003 année Venezuela, RB. Les données jusqu'à 1993 année ne sont pas présentés. Quantité d'observations actuelles selon dates: 10.
Source (désignation):
Les indicateurs du développement mondiale
Source (organisation):
World Federation of Exchanges database.
Catégories:
Financial Sector
Dernière mise à jour
23 avr. 2017
Les indicateurs de changement de valeurs selon les années
En moyenne:
16.559
Minimum:
2.231
1 janv. 2003
Maximum:
26.943
1 janv. 2001
Pour la date d''observation
Valeur
Changement absolu
Le changement par rapport à la valeur précédente
1 janv. 1994
20.429
+20.429
0.0%
1 janv. 1995
19.233
-1.196
-5.85%
1 janv. 1996
7.688
-11.545
-60.03%
1 janv. 1997
12.581
+4.893
63.64%
1 janv. 1998
24.865
+12.284
97.64%
1 janv. 1999
20.495
-4.37
-17.57%
1 janv. 2000
12.668
-7.828
-38.19%
1 janv. 2001
26.943
+14.276
112.69%
1 janv. 2002
18.453
-8.49
-31.51%
1 janv. 2003
2.231
-16.222
-87.91%
Classement des pays selon les statistiques actuelles par années

Commentaires:

Envoyer
PremiumAbout & FeedbackUn accordConfidentialité
logo
© 2022 Selected Technologies LLC – Morgan Hill, California