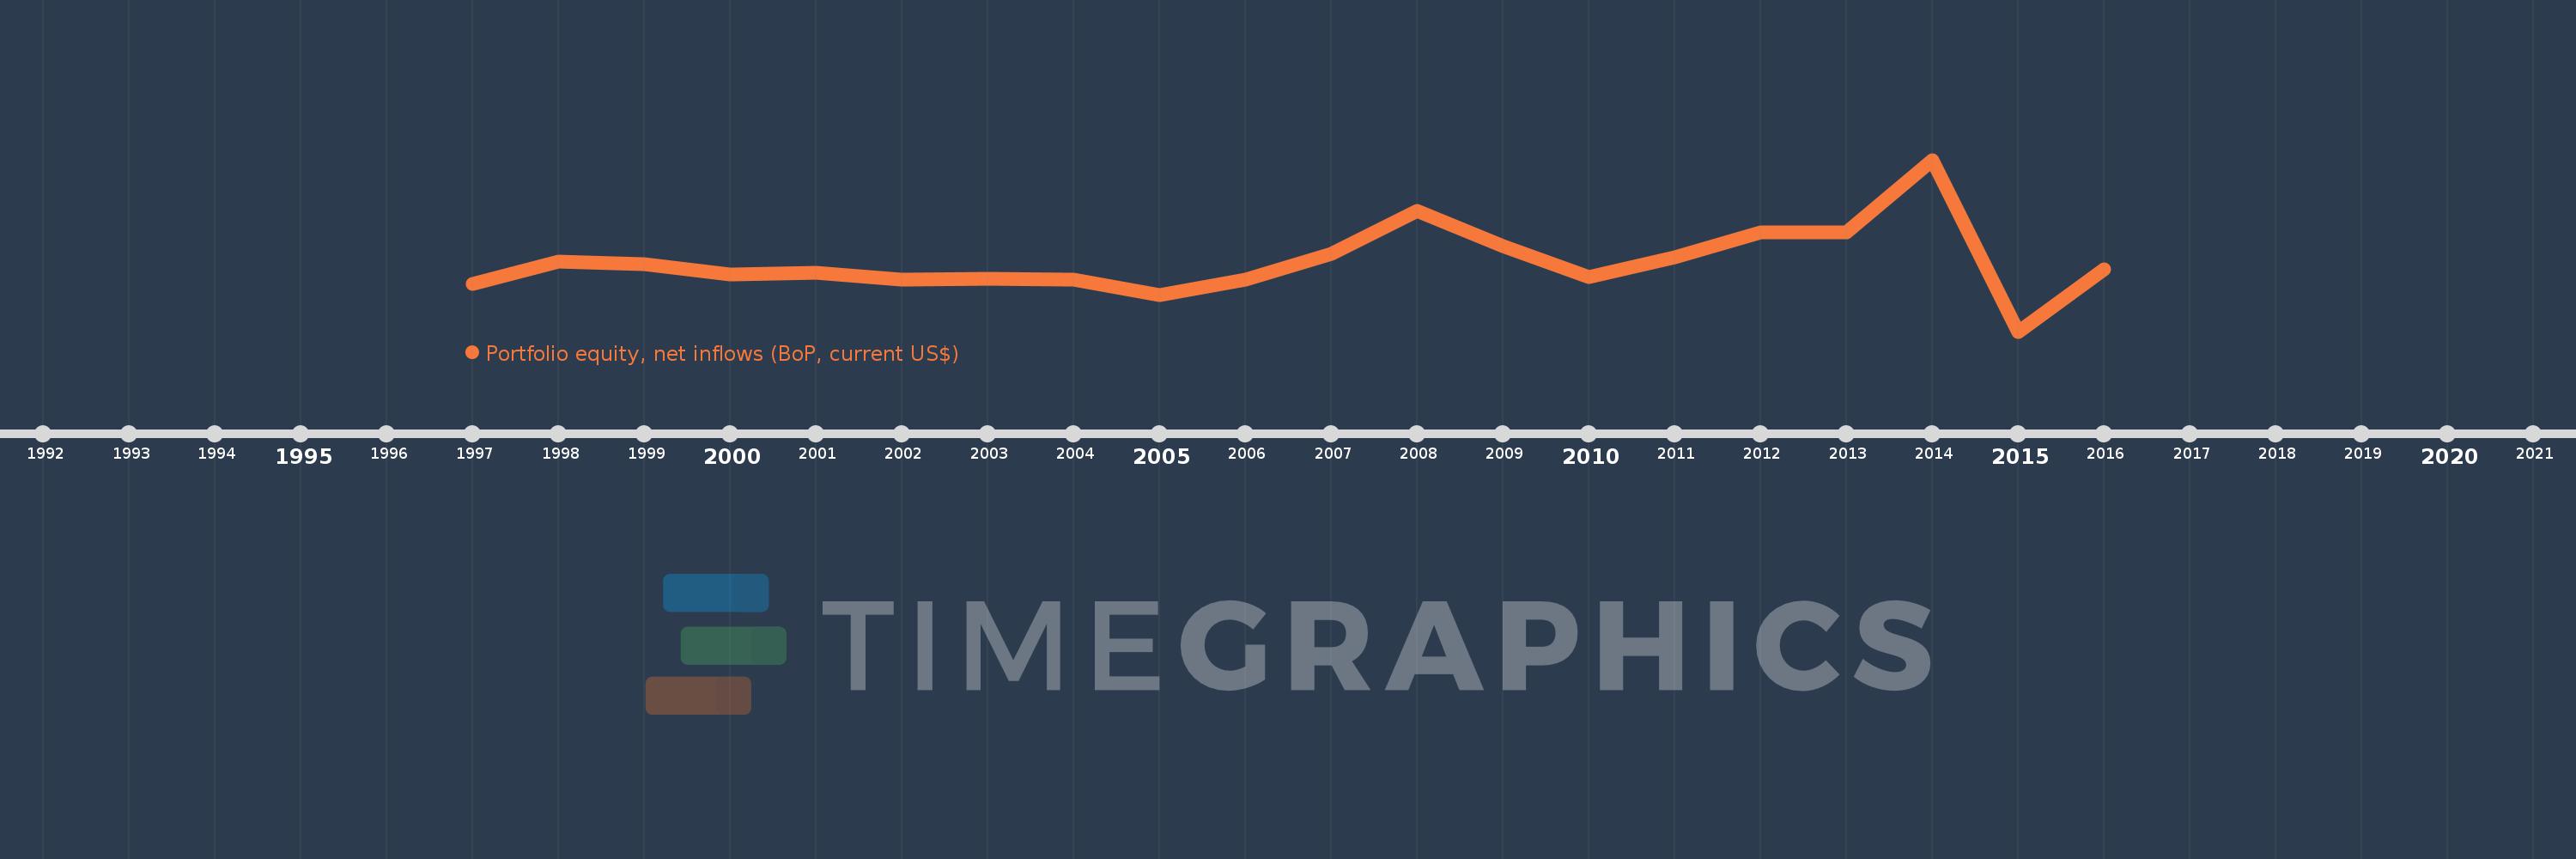
Cette échelle de temps montre un graphique de 1997 année à 2016 année Ukraine. Les données jusqu'à 1996 année ne sont pas présentés. Quantité d'observations actuelles selon dates: 20.
Source (désignation):
Les indicateurs du développement mondiale
Source (organisation):
International Monetary Fund, Balance of Payments database, and World Bank, International Debt Statistics.
Catégories:
Economy & Growth, Financial Sector, External Debt
Dernière mise à jour
23 avr. 2017
Les indicateurs de changement de valeurs selon les années
En moyenne:
245.2 mln.
Minimum:
-391.0 mln.
1 janv. 2015
Maximum:
1.18 mds
1 janv. 2014
Pour la date d''observation
Valeur
Changement absolu
Le changement par rapport à la valeur précédente
1 janv. 1997
46.0 mln.
+46.0 mln.
0.0%
1 janv. 1998
248.0 mln.
+202.0 mln.
439.13%
1 janv. 1999
227.0 mln.
-21.0 mln.
-8.47%
1 janv. 2000
129.0 mln.
-98.0 mln.
-43.17%
1 janv. 2001
146.0 mln.
+17.0 mln.
13.18%
1 janv. 2002
87.0 mln.
-59.0 mln.
-40.41%
1 janv. 2003
95.0 mln.
+8.0 mln.
9.2%
1 janv. 2004
84.0 mln.
-11.0 mln.
-11.58%
1 janv. 2005
-61.0 mln.
-145.0 mln.
-172.62%
1 janv. 2006
82.0 mln.
+143.0 mln.
-234.43%
1 janv. 2007
322.0 mln.
+240.0 mln.
292.68%
1 janv. 2008
715.0 mln.
+393.0 mln.
122.05%
1 janv. 2009
388.0 mln.
-327.0 mln.
-45.73%
1 janv. 2010
105.0 mln.
-283.0 mln.
-72.94%
1 janv. 2011
290.0 mln.
+185.0 mln.
176.19%
1 janv. 2012
519.0 mln.
+229.0 mln.
78.97%
1 janv. 2013
516.0 mln.
-3.0 mln.
-0.58%
1 janv. 2014
1.18 mds
+664.0 mln.
128.68%
1 janv. 2015
-391.0 mln.
-1.571 mds
-133.14%
1 janv. 2016
177.0 mln.
+568.0 mln.
-145.27%
Classement des pays selon les statistiques actuelles par années