30
/fr/
AIzaSyAYiBZKx7MnpbEhh9jyipgxe19OcubqV5w
April 1, 2024
273150
Ukraine
UKR
true
2
1
Adjusted net national income per capita (annual % growth)
2015,2014,2013,2012,2011,2010,2009,2008,2007,2006,2005,2004,2003,2002,2001,2000,1999,1998,1997
Download
Bibliothèque de statistiques globales →Ukraine →

Adjusted net national income per capita (annual % growth)

Cette statistique dans les autres pays:

AlbaniaAlgeriaAngolaArab WorldArgentinaArmeniaAustraliaAustriaAzerbaijanBahamas, TheBahrainBangladeshBarbadosBelarusBelgiumBelizeBeninBhutanBoliviaBotswanaBrazilBrunei DarussalamBulgariaBurkina FasoBurundiCabo VerdeCambodiaCameroonCanadaCaribbean small statesCentral Europe and the BalticsChadChileChinaColombiaComorosCongo, Dem. Rep.Congo, Rep.Costa RicaCote d'IvoireCroatiaCubaCyprusCzech RepublicDenmarkDjiboutiDominican RepublicEarly-demographic dividendEcuadorEgypt, Arab Rep.El SalvadorEquatorial GuineaEritreaEstoniaEthiopiaEuro areaEurope & Central AsiaEurope & Central Asia (excluding high income)Europe & Central Asia (IDA & IBRD countries)European UnionFijiFinlandFranceGabonGambia, TheGeorgiaGermanyGhanaGreeceGuatemalaGuineaGuinea-BissauHaitiHeavily indebted poor countries (HIPC)High incomeHondurasHungaryIBRD onlyIcelandIDA & IBRD totalIDA blendIDA onlyIDA totalIndiaIndonesiaIran, Islamic Rep.IrelandIsraelItalyJamaicaJapanJordanKazakhstanKenyaKorea, Rep.KuwaitKyrgyz RepublicLao PDRLatin America & Caribbean Latin America & Caribbean (excluding high income)Latin America & the Caribbean (IDA & IBRD countries)LatviaLeast developed countries: UN classificationLebanonLiberiaLibyaLithuaniaLow & middle incomeLow incomeLower middle incomeLuxembourgMacedonia, FYRMadagascarMalawiMalaysiaMaliMauritaniaMauritiusMexicoMiddle East & North AfricaMiddle East & North Africa (excluding high income)Middle East & North Africa (IDA & IBRD countries)Middle incomeMoldovaMongoliaMoroccoMozambiqueMyanmarNamibiaNepalNetherlandsNew ZealandNicaraguaNigerNigeriaNorth AmericaNorwayOECD membersOmanOther small statesPakistanPanamaPapua New GuineaParaguayPeruPhilippinesPolandPortugalPost-demographic dividendPre-demographic dividendQatarRomaniaRussian FederationRwandaSamoaSaudi ArabiaSenegalSeychellesSierra LeoneSingaporeSlovak RepublicSloveniaSmall statesSouth AfricaSouth AsiaSouth Asia (IDA & IBRD)SpainSri LankaSub-Saharan Africa Sub-Saharan Africa (excluding high income)Sub-Saharan Africa (IDA & IBRD countries)SudanSurinameSwazilandSwedenSwitzerlandSyrian Arab RepublicTajikistanTanzaniaThailandTogoTrinidad and TobagoTunisiaTurkeyTurkmenistanUgandaUkraineUnited Arab EmiratesUnited KingdomUnited StatesUruguayUzbekistanVanuatuVenezuela, RBVietnamWorldZambiaZimbabwe

La ligne de temps

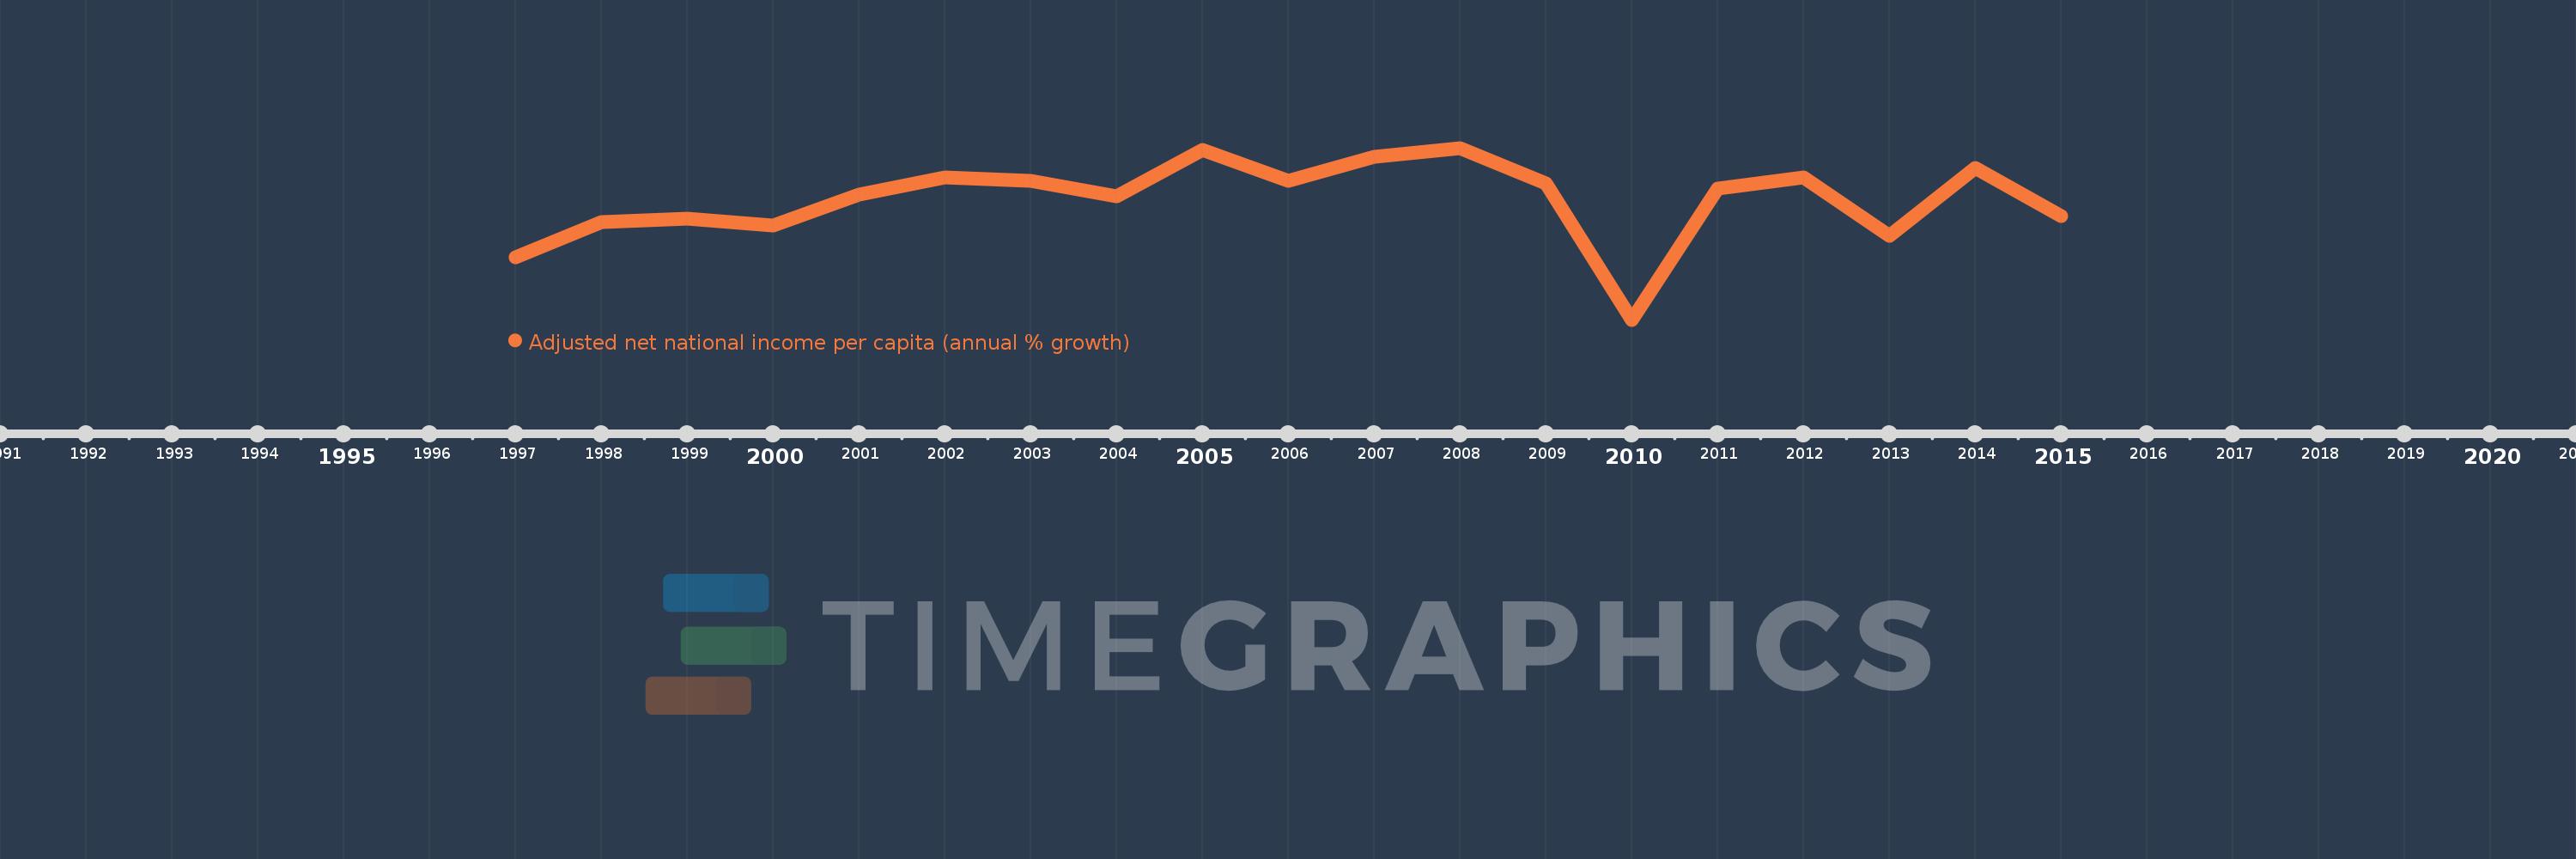
Cette échelle de temps montre un graphique de 1997 année à 2015 année Ukraine. Les données jusqu'à 1996 année ne sont pas présentés. Quantité d'observations actuelles selon dates: 19.

Source (désignation):

Les indicateurs du développement mondiale

Source (organisation):

World Bank staff estimates based on sources and methods in World Bank's "The Changing Wealth of Nations: Measuring Sustainable Development in the New Millennium" (2011).

Catégories:

Economy & Growth

Dernière mise à jour

23 avr. 2017

Les indicateurs de changement de valeurs selon les années

En moyenne:
3.711
Minimum:
-22.215
1 janv. 2010
Maximum:
14.928
1 janv. 2008
Pour la date d''observation
Valeur
Changement absolu
Le changement par rapport à la valeur précédente
1 janv. 1997
-8.803
-8.803
0.0%
1 janv. 1998
-1.127
+7.675
-87.19%
1 janv. 1999
-0.32
+0.808
-71.65%
1 janv. 2000
-1.802
-1.483
463.91%
1 janv. 2001
4.822
+6.625
-367.54%
1 janv. 2002
8.611
+3.789
78.58%
1 janv. 2003
7.773
-0.838
-9.73%
1 janv. 2004
4.519
-3.254
-41.86%
1 janv. 2005
14.575
+10.055
222.51%
1 janv. 2006
7.826
-6.748
-46.3%
1 janv. 2007
12.99
+5.164
65.98%
1 janv. 2008
14.928
+1.938
14.92%
1 janv. 2009
7.257
-7.671
-51.38%
1 janv. 2010
-22.215
-29.473
-406.1%
1 janv. 2011
6.144
+28.359
-127.66%
1 janv. 2012
8.585
+2.441
39.73%
1 janv. 2013
-4.131
-12.717
-148.12%
1 janv. 2014
10.585
+14.717
-356.22%
1 janv. 2015
0.292
-10.293
-97.24%

Classement des pays selon les statistiques actuelles par années