33
/fr/
AIzaSyB4mHJ5NPEv-XzF7P6NDYXjlkCWaeKw5bc
November 30, 2025
267541
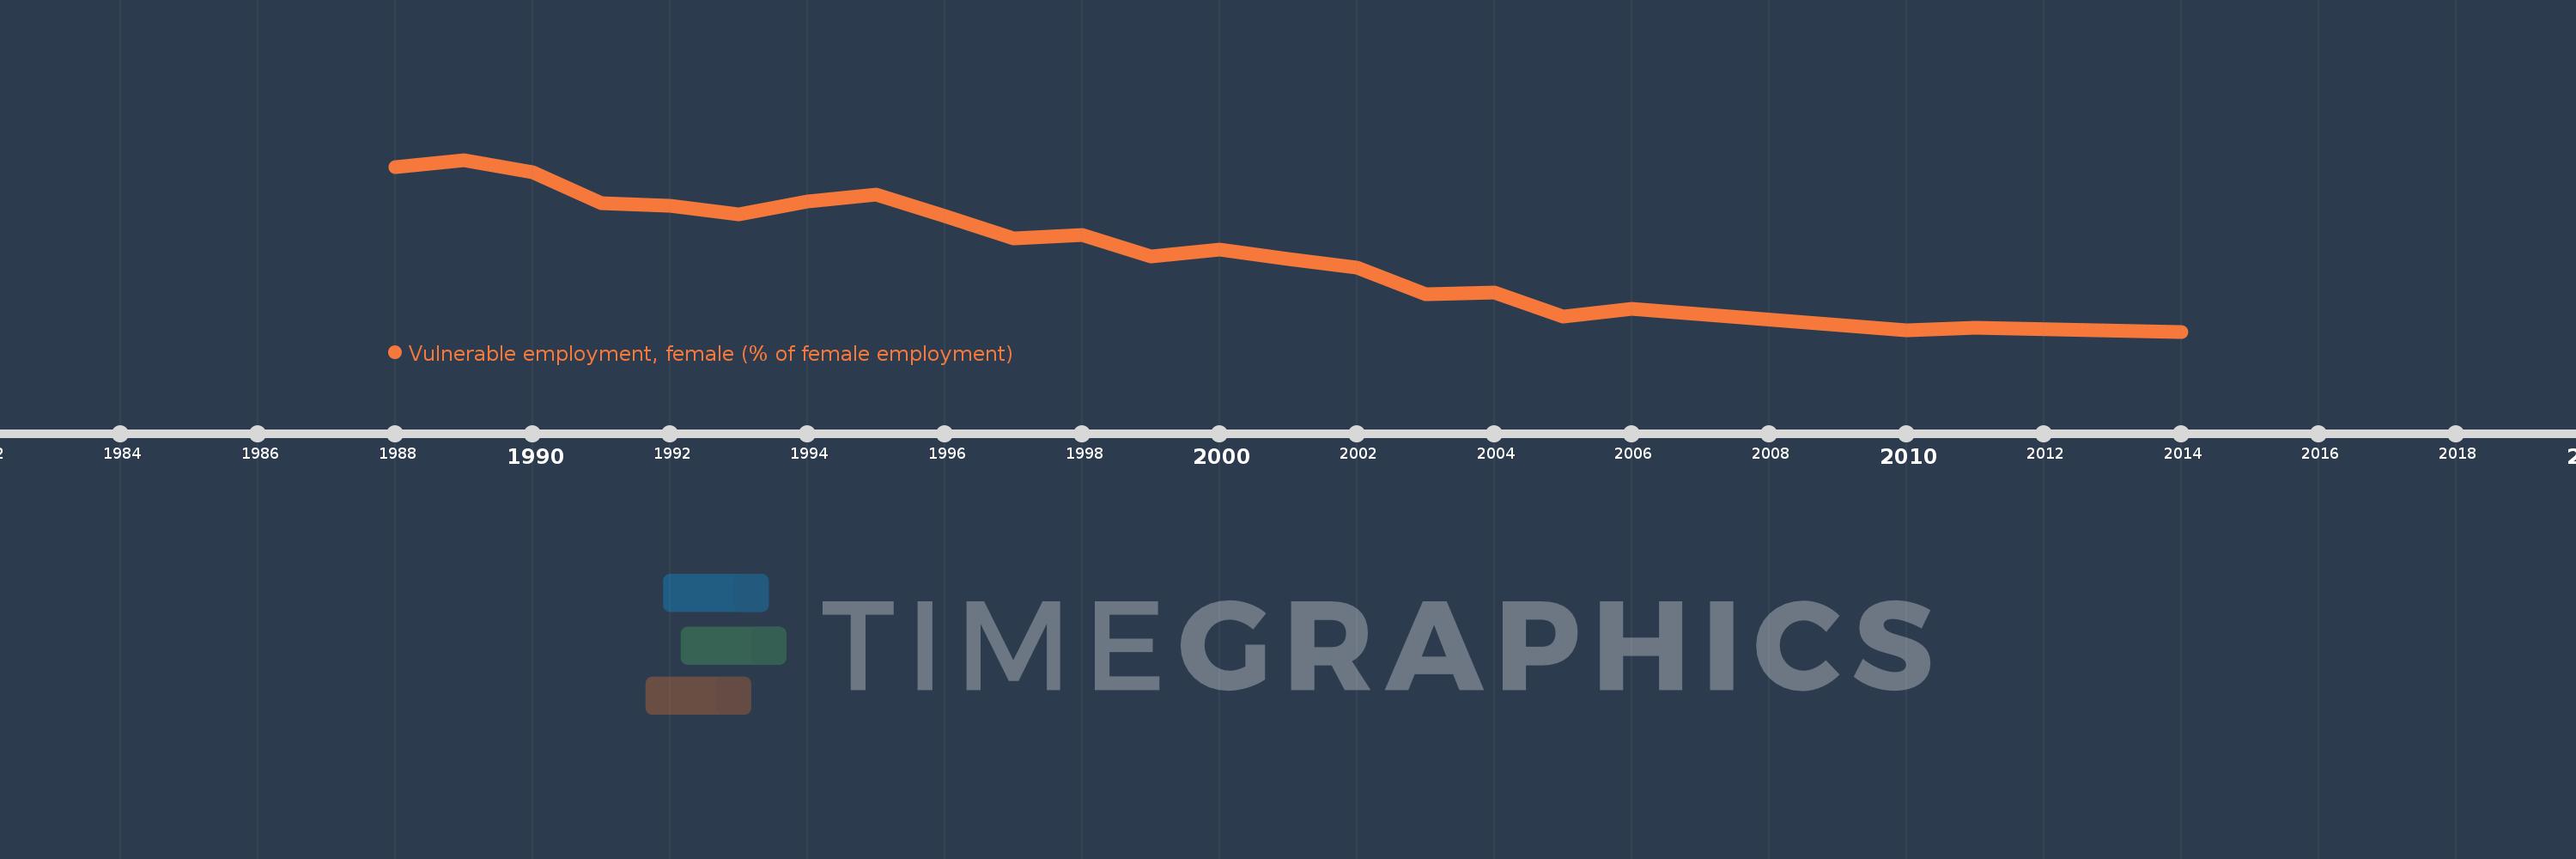
Trinidad and Tobago
TTO
true
2
1
Vulnerable employment, female (% of female employment)
2014,2011,2010,2006,2005,2004,2003,2002,2001,2000,1999,1998,1997,1996,1995,1994,1993,1992,1991,1990,1989,1988