30
/fr/
AIzaSyAYiBZKx7MnpbEhh9jyipgxe19OcubqV5w
April 1, 2024
265831
Tonga
TON
true
2
1
Gross savings (current LCU)
2013,2012,2011,2010,2009,2008,2007,2006,2005,2004,2003,2002,1994,1993,1992,1991,1990,1989,1988,1987,1986,1985,1984,1983,1982
Download
Bibliothèque de statistiques globales →Tonga →

Gross savings (current LCU)

Cette statistique dans les autres pays:

AfghanistanAlbaniaAlgeriaAngolaAntigua and BarbudaArgentinaArmeniaAustraliaAustriaAzerbaijanBahamas, TheBahrainBangladeshBarbadosBelarusBelgiumBelizeBeninBermudaBhutanBoliviaBosnia and HerzegovinaBotswanaBrazilBrunei DarussalamBulgariaBurkina FasoBurundiCabo VerdeCambodiaCameroonCanadaCentral African RepublicChadChileChinaColombiaComorosCongo, Dem. Rep.Congo, Rep.Costa RicaCote d'IvoireCroatiaCyprusCzech RepublicDenmarkDjiboutiDominicaDominican RepublicEcuadorEgypt, Arab Rep.El SalvadorEquatorial GuineaEritreaEstoniaEthiopiaFaroe IslandsFijiFinlandFranceGabonGambia, TheGeorgiaGermanyGhanaGreeceGrenadaGuatemalaGuineaGuinea-BissauGuyanaHaitiHondurasHong Kong SAR, ChinaHungaryIcelandIndiaIndonesiaIran, Islamic Rep.IraqIrelandIsraelItalyJamaicaJapanJordanKazakhstanKenyaKiribatiKorea, Rep.KosovoKuwaitKyrgyz RepublicLao PDRLatviaLebanonLesothoLiberiaLibyaLithuaniaLuxembourgMacao SAR, ChinaMacedonia, FYRMadagascarMalawiMalaysiaMaldivesMaliMaltaMauritaniaMauritiusMexicoMoldovaMongoliaMontenegroMoroccoMozambiqueNamibiaNepalNetherlandsNew ZealandNicaraguaNigerNigeriaNorwayOmanPakistanPanamaPapua New GuineaParaguayPeruPhilippinesPolandPortugalQatarRomaniaRussian FederationRwandaSaudi ArabiaSenegalSerbiaSeychellesSierra LeoneSingaporeSlovak RepublicSloveniaSolomon IslandsSouth AfricaSouth SudanSpainSri LankaSt. Kitts and NevisSt. LuciaSt. Vincent and the GrenadinesSudanSurinameSwazilandSwedenSwitzerlandSyrian Arab RepublicTajikistanTanzaniaThailandTimor-LesteTogoTongaTrinidad and TobagoTunisiaTurkeyUgandaUkraineUnited KingdomUnited StatesUruguayVanuatuVenezuela, RBVietnamWest Bank and GazaYemen, Rep.ZambiaZimbabwe

La ligne de temps

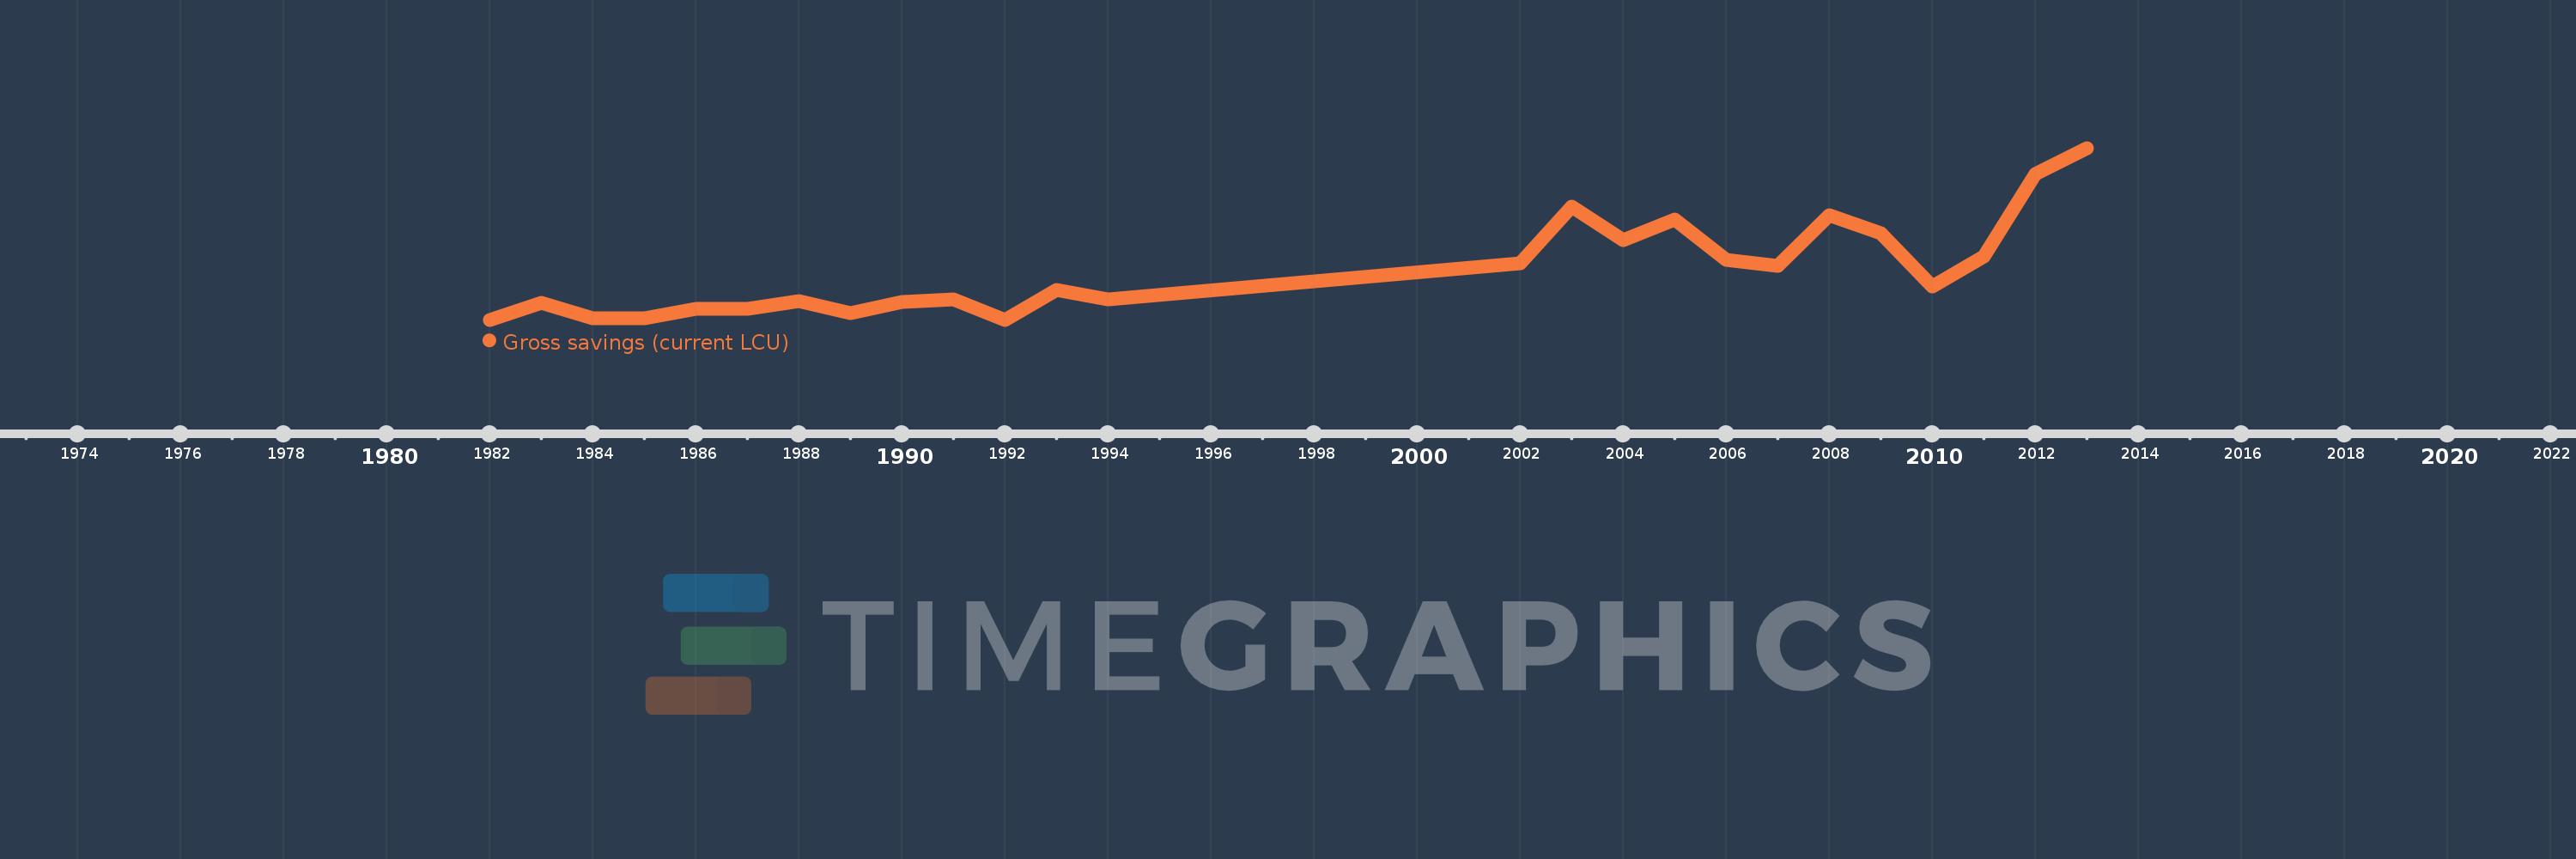
Cette échelle de temps montre un graphique de 1982 année à 2013 année Tonga. Les données jusqu'à 1981 année ne sont pas présentés. Quantité d'observations actuelles selon dates: 25.

Source (désignation):

Les indicateurs du développement mondiale

Source (organisation):

World Bank national accounts data, and OECD National Accounts data files.

Catégories:

Economy & Growth

Dernière mise à jour

23 avr. 2017

Les indicateurs de changement de valeurs selon les années

En moyenne:
62.458 mln.
Minimum:
13.193 mln.
1 janv. 1992
Maximum:
185.895 mln.
1 janv. 2013
Pour la date d''observation
Valeur
Changement absolu
Le changement par rapport à la valeur précédente
1 janv. 1982
13.211 mln.
+13.211 mln.
0.0%
1 janv. 1983
30.602 mln.
+17.391 mln.
131.65%
1 janv. 1984
14.451 mln.
-16.151 mln.
-52.78%
1 janv. 1985
14.693 mln.
+242.054 milles
1.68%
1 janv. 1986
24.556 mln.
+9.863 mln.
67.13%
1 janv. 1987
24.283 mln.
-273.602 milles
-1.11%
1 janv. 1988
31.901 mln.
+7.618 mln.
31.37%
1 janv. 1989
20.068 mln.
-11.833 mln.
-37.09%
1 janv. 1990
31.391 mln.
+11.323 mln.
56.42%
1 janv. 1991
33.489 mln.
+2.098 mln.
6.68%
1 janv. 1992
13.193 mln.
-20.295 mln.
-60.6%
1 janv. 1993
43.353 mln.
+30.159 mln.
228.59%
1 janv. 1994
33.828 mln.
-9.525 mln.
-21.97%
1 janv. 2002
70.197 mln.
+36.369 mln.
107.51%
1 janv. 2003
126.749 mln.
+56.552 mln.
80.56%
1 janv. 2004
93.24 mln.
-33.508 mln.
-26.44%
1 janv. 2005
114.145 mln.
+20.905 mln.
22.42%
1 janv. 2006
73.126 mln.
-41.02 mln.
-35.94%
1 janv. 2007
66.927 mln.
-6.198 mln.
-8.48%
1 janv. 2008
118.666 mln.
+51.738 mln.
77.31%
1 janv. 2009
99.814 mln.
-18.852 mln.
-15.89%
1 janv. 2010
46.654 mln.
-53.16 mln.
-53.26%
1 janv. 2011
76.853 mln.
+30.2 mln.
64.73%
1 janv. 2012
160.159 mln.
+83.305 mln.
108.4%
1 janv. 2013
185.895 mln.
+25.736 mln.
16.07%

Classement des pays selon les statistiques actuelles par années