33
/fr/
AIzaSyAYiBZKx7MnpbEhh9jyipgxe19OcubqV5w
August 1, 2025
263777
Timor-Leste
TLS
true
2
1
Net bilateral aid flows from DAC donors, New Zealand (current US$)
2015,2014,2013,2012,2011,2010,2009,2008,2007,2006,2005,2004,2003,2002,2001,2000,1998
Download
Bibliothèque de statistiques globales →Timor-Leste →

Net bilateral aid flows from DAC donors, New Zealand (current US$)

Cette statistique dans les autres pays:

AfghanistanAlgeriaAngolaAntigua and BarbudaArab WorldArgentinaBahamas, TheBangladeshBarbadosBelizeBeninBhutanBoliviaBosnia and HerzegovinaBotswanaBrazilBrunei DarussalamBurkina FasoBurundiCambodiaCameroonCaribbean small statesCentral African RepublicCentral Europe and the BalticsChadChileChinaColombiaComorosCongo, Dem. Rep.Costa RicaCote d'IvoireCyprusCzech RepublicDjiboutiDominicaEast Asia & PacificEast Asia & Pacific (excluding high income)East Asia & Pacific (IDA & IBRD countries)EcuadorEgypt, Arab Rep.El SalvadorEritreaEthiopiaEuro areaEurope & Central AsiaEurope & Central Asia (excluding high income)Europe & Central Asia (IDA & IBRD countries)European UnionFijiFragile and conflict affected situationsFrench PolynesiaGambia, TheGhanaGrenadaGuatemalaGuinea-BissauGuyanaHaitiHeavily indebted poor countries (HIPC)High incomeHondurasHong Kong SAR, ChinaHungaryIBRD onlyIDA & IBRD totalIDA blendIDA onlyIDA totalIndiaIndonesiaIran, Islamic Rep.IraqIsraelJamaicaJordanKazakhstanKenyaKiribatiKorea, Dem. People’s Rep.Korea, Rep.KuwaitKyrgyz RepublicLao PDRLatin America & Caribbean Latin America & Caribbean (excluding high income)Latin America & the Caribbean (IDA & IBRD countries)Least developed countries: UN classificationLebanonLesothoLiberiaLibyaLow & middle incomeLow incomeLower middle incomeMadagascarMalawiMalaysiaMaldivesMaliMaltaMarshall IslandsMauritaniaMauritiusMexicoMicronesia, Fed. Sts.Middle East & North AfricaMiddle East & North Africa (excluding high income)Middle East & North Africa (IDA & IBRD countries)Middle incomeMongoliaMoroccoMozambiqueMyanmarNamibiaNauruNepalNew CaledoniaNicaraguaNigerNigeriaNorthern Mariana IslandsOECD membersOther small statesPacific island small statesPakistanPalauPapua New GuineaParaguayPeruPhilippinesRussian FederationRwandaSamoaSenegalSerbiaSeychellesSierra LeoneSingaporeSlovak RepublicSmall statesSolomon IslandsSomaliaSouth AfricaSouth AsiaSouth Asia (IDA & IBRD)South SudanSri LankaSt. LuciaSt. Vincent and the GrenadinesSub-Saharan Africa Sub-Saharan Africa (excluding high income)Sub-Saharan Africa (IDA & IBRD countries)SudanSurinameSwazilandSyrian Arab RepublicTajikistanTanzaniaThailandTimor-LesteTongaTrinidad and TobagoTunisiaTurkeyTurkmenistanTuvaluUgandaUpper middle incomeUruguayUzbekistanVanuatuVenezuela, RBVietnamWest Bank and GazaWorldYemen, Rep.ZambiaZimbabwe

La ligne de temps

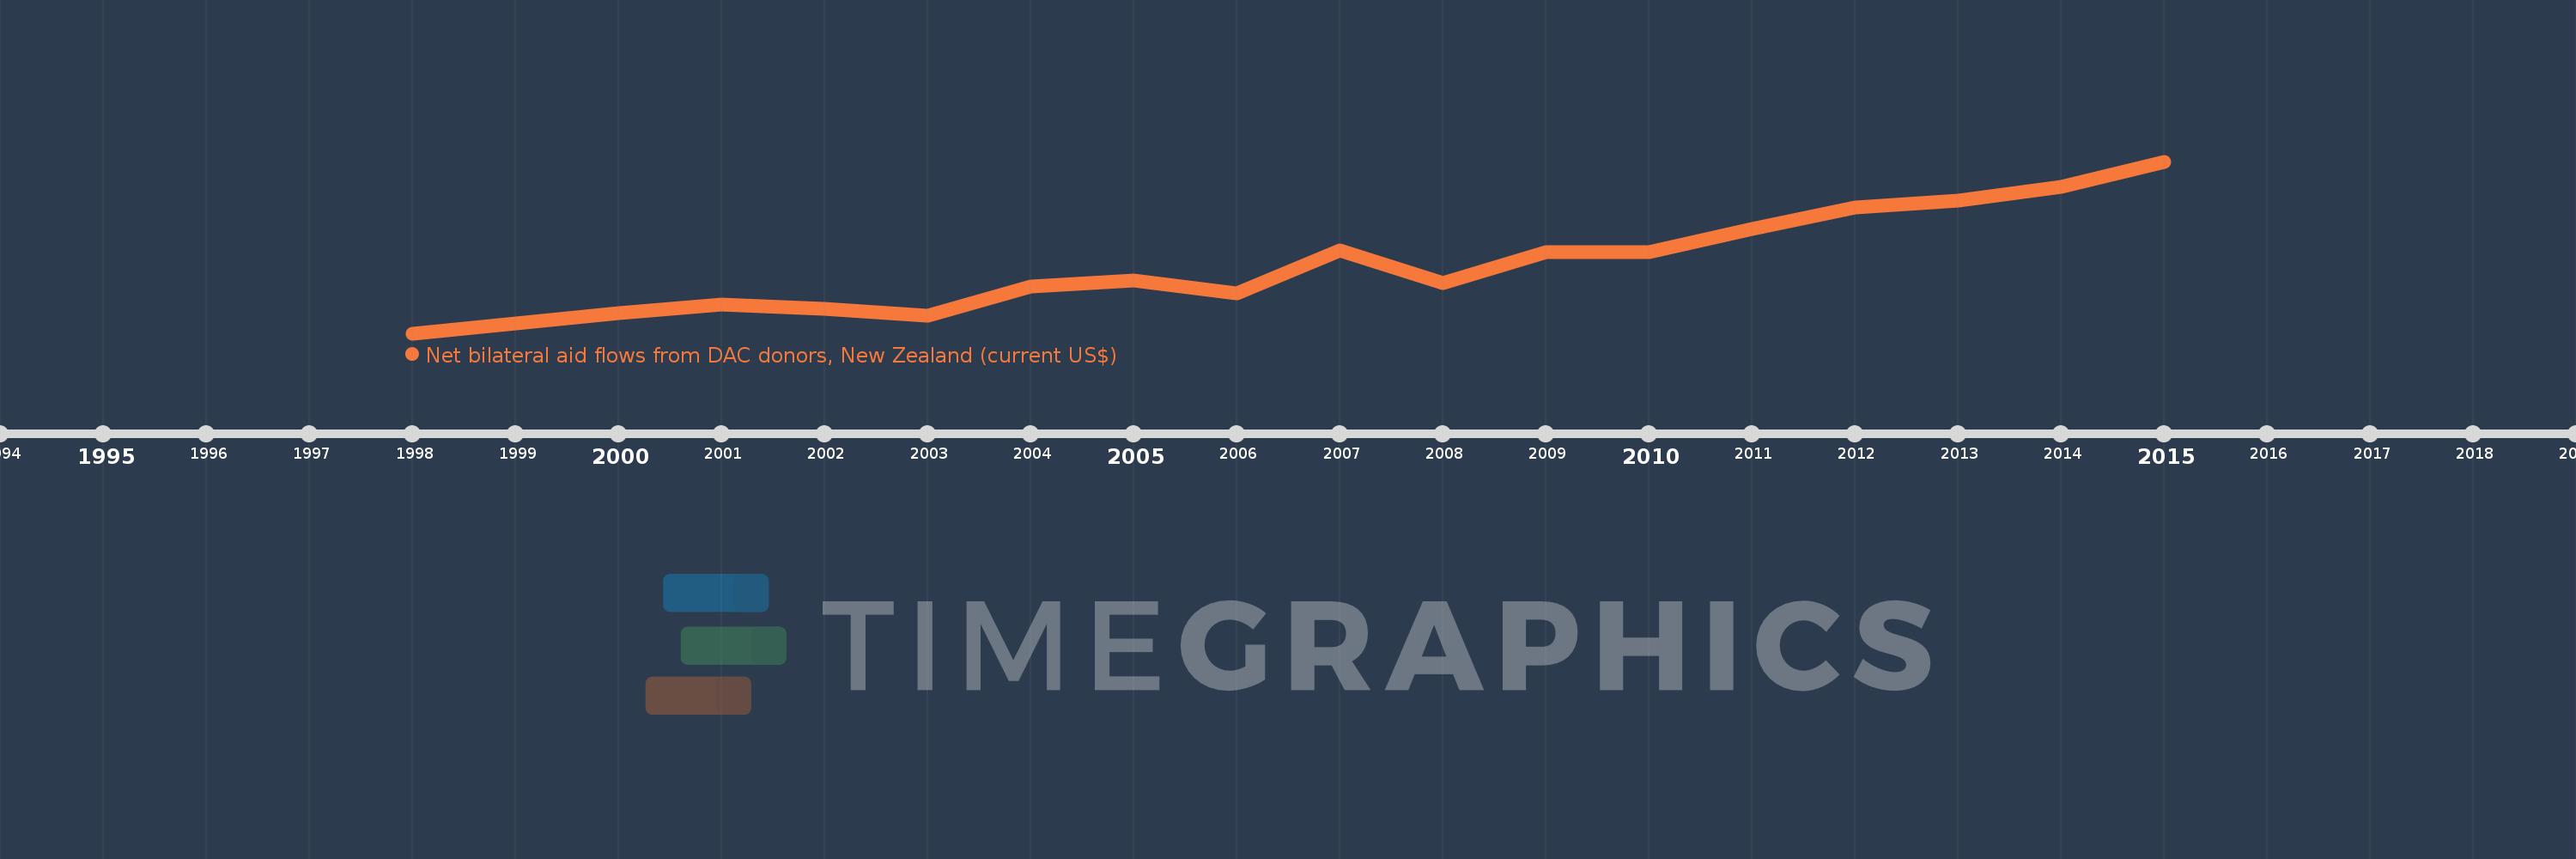
Cette échelle de temps montre un graphique de 1998 année à 2015 année Timor-Leste. Les données jusqu'à 1997 année ne sont pas présentés. Quantité d'observations actuelles selon dates: 17.

Source (désignation):

Les indicateurs du développement mondiale

Source (organisation):

Development Assistance Committee of the Organisation for Economic Co-operation and Development, Geographical Distribution of Financial Flows to Developing Countries, Development Co-operation Report, and International Development Statistics database. Data are available online at: www.oecd.org/dac/stats/idsonline.

Catégories:

Aid Effectiveness

Dernière mise à jour

23 avr. 2017

Les indicateurs de changement de valeurs selon les années

En moyenne:
4.467 mln.
Minimum:
10.0 milles
1 janv. 1998
Maximum:
10.8 mln.
1 janv. 2015
Pour la date d''observation
Valeur
Changement absolu
Le changement par rapport à la valeur précédente
1 janv. 1998
10.0 milles
+10.0 milles
0.0%
1 janv. 2000
1.27 mln.
+1.26 mln.
12.6 milles%
1 janv. 2001
1.81 mln.
+540.0 milles
42.52%
1 janv. 2002
1.57 mln.
-240.0 milles
-13.26%
1 janv. 2003
1.14 mln.
-430.0 milles
-27.39%
1 janv. 2004
2.93 mln.
+1.79 mln.
157.02%
1 janv. 2005
3.32 mln.
+390.0 milles
13.31%
1 janv. 2006
2.52 mln.
-800.0 milles
-24.1%
1 janv. 2007
5.2 mln.
+2.68 mln.
106.35%
1 janv. 2008
3.15 mln.
-2.05 mln.
-39.42%
1 janv. 2009
5.1 mln.
+1.95 mln.
61.9%
1 janv. 2010
5.1 mln.
0.0
0.0%
1 janv. 2011
6.58 mln.
+1.48 mln.
29.02%
1 janv. 2012
7.93 mln.
+1.35 mln.
20.52%
1 janv. 2013
8.32 mln.
+390.0 milles
4.92%
1 janv. 2014
9.19 mln.
+870.0 milles
10.46%
1 janv. 2015
10.8 mln.
+1.61 mln.
17.52%

Classement des pays selon les statistiques actuelles par années