33
/fr/
AIzaSyAYiBZKx7MnpbEhh9jyipgxe19OcubqV5w
August 1, 2025
263626
Timor-Leste
TLS
true
2
1
Industry, value added (current US$)
2015,2014,2013,2012,2011,2010,2009,2008,2007,2006,2005,2004,2003,2002,2001
Download
Bibliothèque de statistiques globales →Timor-Leste →

Industry, value added (current US$)

Cette statistique dans les autres pays:

AfghanistanAlbaniaAlgeriaAndorraAngolaAntigua and BarbudaArab WorldArgentinaArmeniaArubaAustraliaAustriaAzerbaijanBahamas, TheBahrainBangladeshBarbadosBelarusBelgiumBelizeBeninBermudaBhutanBoliviaBosnia and HerzegovinaBotswanaBrazilBrunei DarussalamBulgariaBurkina FasoBurundiCabo VerdeCambodiaCameroonCanadaCaribbean small statesCayman IslandsCentral African RepublicCentral Europe and the BalticsChadChileChinaColombiaComorosCongo, Dem. Rep.Congo, Rep.Costa RicaCote d'IvoireCroatiaCubaCyprusCzech RepublicDenmarkDjiboutiDominicaDominican RepublicEarly-demographic dividendEast Asia & PacificEast Asia & Pacific (excluding high income)East Asia & Pacific (IDA & IBRD countries)EcuadorEgypt, Arab Rep.El SalvadorEquatorial GuineaEritreaEstoniaEthiopiaEuro areaEurope & Central AsiaEurope & Central Asia (excluding high income)Europe & Central Asia (IDA & IBRD countries)European UnionFijiFinlandFragile and conflict affected situationsFranceGabonGambia, TheGeorgiaGermanyGhanaGreeceGrenadaGuatemalaGuineaGuinea-BissauGuyanaHeavily indebted poor countries (HIPC)High incomeHondurasHong Kong SAR, ChinaHungaryIBRD onlyIcelandIDA & IBRD totalIDA blendIDA onlyIDA totalIndiaIndonesiaIran, Islamic Rep.IraqIrelandItalyJamaicaJapanJordanKazakhstanKenyaKiribatiKorea, Rep.KosovoKuwaitKyrgyz RepublicLao PDRLate-demographic dividendLatin America & Caribbean Latin America & Caribbean (excluding high income)Latin America & the Caribbean (IDA & IBRD countries)LatviaLeast developed countries: UN classificationLebanonLesothoLiberiaLibyaLiechtensteinLithuaniaLow & middle incomeLow incomeLower middle incomeLuxembourgMacao SAR, ChinaMacedonia, FYRMadagascarMalawiMalaysiaMaldivesMaliMaltaMarshall IslandsMauritaniaMauritiusMexicoMicronesia, Fed. Sts.Middle East & North AfricaMiddle East & North Africa (excluding high income)Middle East & North Africa (IDA & IBRD countries)Middle incomeMoldovaMongoliaMontenegroMoroccoMozambiqueMyanmarNamibiaNepalNetherlandsNew CaledoniaNew ZealandNicaraguaNigerNigeriaNorth AmericaNorwayOECD membersOmanOther small statesPacific island small statesPakistanPalauPanamaPapua New GuineaParaguayPeruPhilippinesPolandPortugalPost-demographic dividendPre-demographic dividendPuerto RicoQatarRomaniaRussian FederationRwandaSamoaSao Tome and PrincipeSaudi ArabiaSenegalSerbiaSeychellesSierra LeoneSingaporeSlovak RepublicSloveniaSmall statesSolomon IslandsSouth AfricaSouth AsiaSouth Asia (IDA & IBRD)SpainSri LankaSt. Kitts and NevisSt. LuciaSt. Vincent and the GrenadinesSub-Saharan Africa Sub-Saharan Africa (excluding high income)Sub-Saharan Africa (IDA & IBRD countries)SudanSurinameSwazilandSwedenSwitzerlandSyrian Arab RepublicTajikistanTanzaniaThailandTimor-LesteTogoTongaTrinidad and TobagoTunisiaTurkeyTurkmenistanTuvaluUgandaUkraineUnited Arab EmiratesUnited KingdomUnited StatesUpper middle incomeUruguayUzbekistanVanuatuVenezuela, RBVietnamWest Bank and GazaWorldYemen, Rep.ZambiaZimbabwe

La ligne de temps

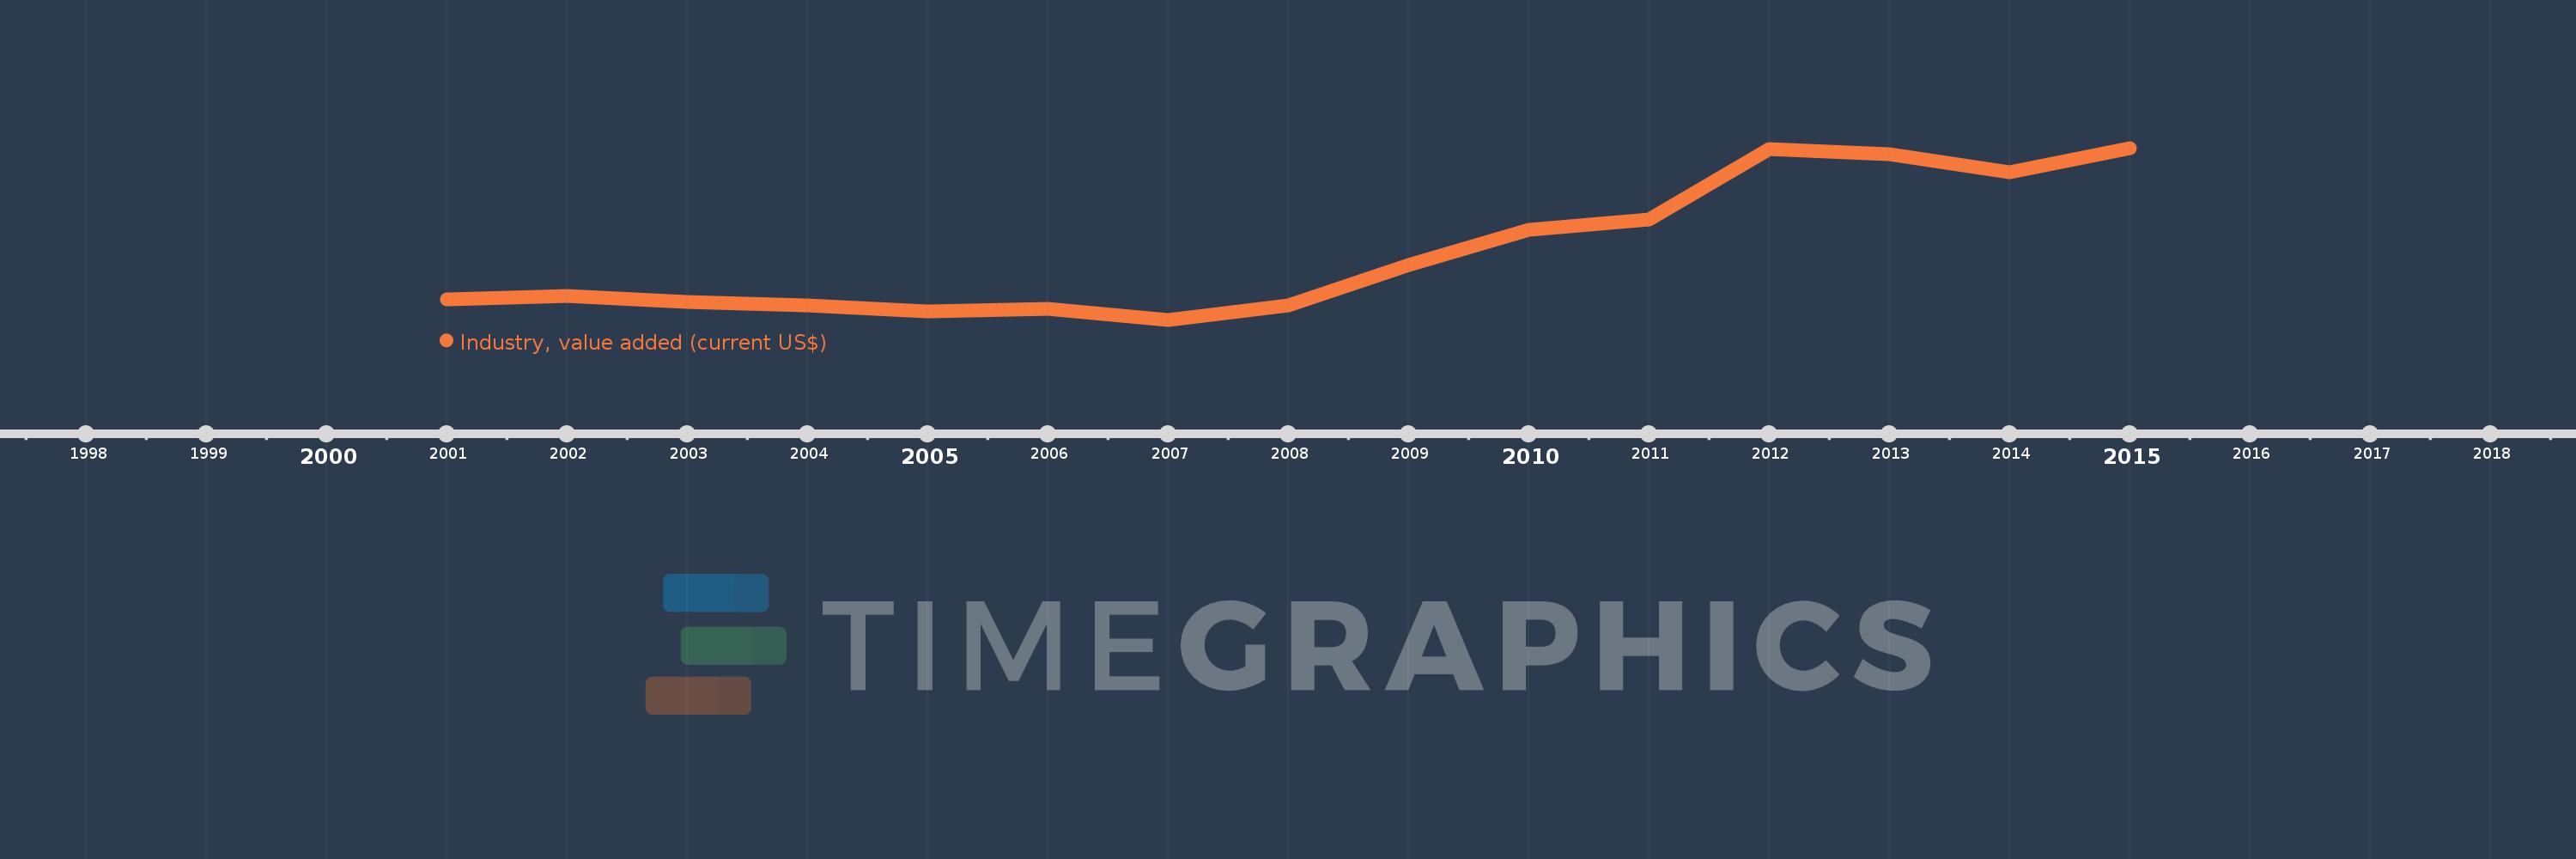
Cette échelle de temps montre un graphique de 2001 année à 2015 année Timor-Leste. Les données jusqu'à 2000 année ne sont pas présentés. Quantité d'observations actuelles selon dates: 15.

Source (désignation):

Les indicateurs du développement mondiale

Source (organisation):

World Bank national accounts data, and OECD National Accounts data files.

Catégories:

Economy & Growth

Dernière mise à jour

23 avr. 2017

Les indicateurs de changement de valeurs selon les années

En moyenne:
121.933 mln.
Minimum:
32.0 mln.
1 janv. 2007
Maximum:
261.0 mln.
1 janv. 2015
Pour la date d''observation
Valeur
Changement absolu
Le changement par rapport à la valeur précédente
1 janv. 2001
59.0 mln.
+59.0 mln.
0.0%
1 janv. 2002
64.0 mln.
+5.0 mln.
8.47%
1 janv. 2003
56.0 mln.
-8.0 mln.
-12.5%
1 janv. 2004
51.0 mln.
-5.0 mln.
-8.93%
1 janv. 2005
43.0 mln.
-8.0 mln.
-15.69%
1 janv. 2006
47.0 mln.
+4.0 mln.
9.3%
1 janv. 2007
32.0 mln.
-15.0 mln.
-31.91%
1 janv. 2008
51.0 mln.
+19.0 mln.
59.38%
1 janv. 2009
105.0 mln.
+54.0 mln.
105.88%
1 janv. 2010
152.0 mln.
+47.0 mln.
44.76%
1 janv. 2011
166.0 mln.
+14.0 mln.
9.21%
1 janv. 2012
260.0 mln.
+94.0 mln.
56.63%
1 janv. 2013
253.0 mln.
-7.0 mln.
-2.69%
1 janv. 2014
229.0 mln.
-24.0 mln.
-9.49%
1 janv. 2015
261.0 mln.
+32.0 mln.
13.97%

Classement des pays selon les statistiques actuelles par années