33
/fr/
AIzaSyAYiBZKx7MnpbEhh9jyipgxe19OcubqV5w
August 1, 2025
260201
Tajikistan
TJK
true
2
1
Public and publicly guaranteed debt service (% of GNI)
2016,2015,2014,2013,2012,2011,2010,2009,2008,2007,2006,2005,2004,2003,2002,2001,2000,1999,1998,1997,1995,1994
Download
Bibliothèque de statistiques globales →Tajikistan →

Public and publicly guaranteed debt service (% of GNI)

Cette statistique dans les autres pays:

AfghanistanAlbaniaAlgeriaAngolaArab WorldArgentinaArmeniaAzerbaijanBangladeshBelarusBelizeBeninBhutanBoliviaBosnia and HerzegovinaBotswanaBrazilBulgariaBurkina FasoBurundiCabo VerdeCambodiaCameroonCentral African RepublicCentral Europe and the BalticsChadChinaColombiaComorosCongo, Dem. Rep.Congo, Rep.Costa RicaCote d'IvoireDjiboutiDominicaDominican RepublicEarly-demographic dividendEast Asia & Pacific (excluding high income)East Asia & Pacific (IDA & IBRD countries)EcuadorEgypt, Arab Rep.El SalvadorEritreaEthiopiaEurope & Central Asia (excluding high income)Europe & Central Asia (IDA & IBRD countries)FijiFragile and conflict affected situationsGabonGambia, TheGeorgiaGhanaGrenadaGuatemalaGuineaGuinea-BissauGuyanaHaitiHeavily indebted poor countries (HIPC)HondurasIBRD onlyIDA & IBRD totalIDA blendIDA onlyIDA totalIndiaIndonesiaIran, Islamic Rep.JamaicaJordanKazakhstanKenyaKosovoKyrgyz RepublicLao PDRLate-demographic dividendLatin America & Caribbean Latin America & Caribbean (excluding high income)Latin America & the Caribbean (IDA & IBRD countries)Least developed countries: UN classificationLebanonLesothoLiberiaLow & middle incomeLow incomeLower middle incomeMacedonia, FYRMadagascarMalawiMalaysiaMaldivesMaliMauritaniaMauritiusMexicoMiddle East & North Africa (excluding high income)Middle East & North Africa (IDA & IBRD countries)Middle incomeMoldovaMongoliaMontenegroMoroccoMozambiqueMyanmarNepalNicaraguaNigerNigeriaPacific island small statesPakistanPanamaPapua New GuineaParaguayPeruPhilippinesPre-demographic dividendRomaniaRussian FederationRwandaSamoaSao Tome and PrincipeSenegalSerbiaSierra LeoneSolomon IslandsSomaliaSouth AfricaSouth AsiaSouth Asia (IDA & IBRD)Sri LankaSt. Kitts and NevisSt. LuciaSt. Vincent and the GrenadinesSub-Saharan Africa Sub-Saharan Africa (excluding high income)Sub-Saharan Africa (IDA & IBRD countries)SudanSwazilandSyrian Arab RepublicTajikistanTanzaniaThailandTogoTongaTunisiaTurkeyTurkmenistanUgandaUkraineUpper middle incomeUzbekistanVanuatuVenezuela, RBVietnamYemen, Rep.ZambiaZimbabwe

La ligne de temps

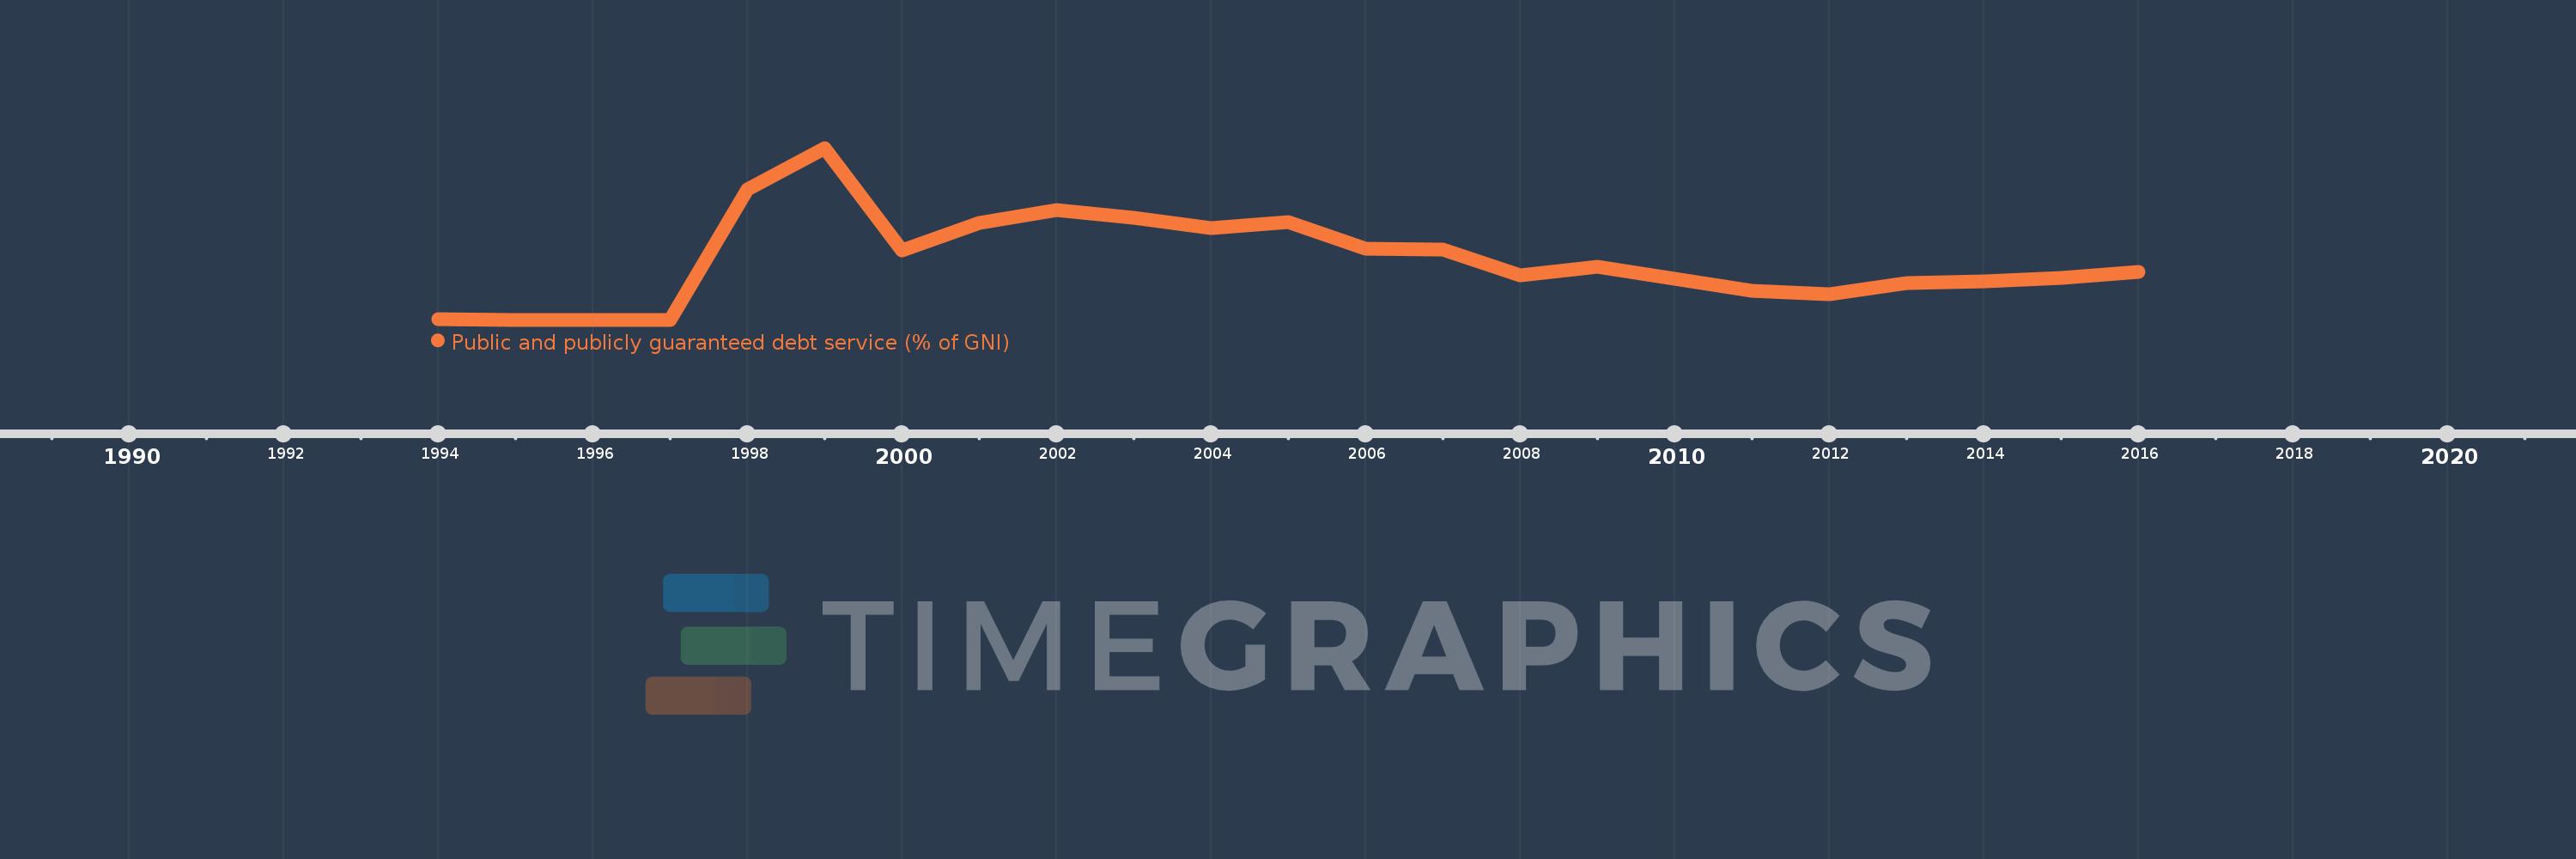
Cette échelle de temps montre un graphique de 1994 année à 2016 année Tajikistan. Les données jusqu'à 1993 année ne sont pas présentés. Quantité d'observations actuelles selon dates: 22.

Source (désignation):

Les indicateurs du développement mondiale

Source (organisation):

World Bank, International Debt Statistics.

Catégories:

External Debt

Dernière mise à jour

23 avr. 2017

Les indicateurs de changement de valeurs selon les années

En moyenne:
1.79
Minimum:
0.029
1 janv. 1997
Maximum:
4.893
1 janv. 1999
Pour la date d''observation
Valeur
Changement absolu
Le changement par rapport à la valeur précédente
1 janv. 1994
0.052
+0.052
0.0%
1 janv. 1995
0.031
-0.021
-40.95%
1 janv. 1997
0.029
-0.002
-6.47%
1 janv. 1998
3.726
+3.697
12.91 milles%
1 janv. 1999
4.893
+1.167
31.33%
1 janv. 2000
1.994
-2.898
-59.24%
1 janv. 2001
2.77
+0.776
38.9%
1 janv. 2002
3.138
+0.368
13.28%
1 janv. 2003
2.918
-0.22
-7.02%
1 janv. 2004
2.616
-0.302
-10.35%
1 janv. 2005
2.793
+0.177
6.76%
1 janv. 2006
2.05
-0.742
-26.59%
1 janv. 2007
2.015
-0.035
-1.71%
1 janv. 2008
1.275
-0.74
-36.72%
1 janv. 2009
1.522
+0.247
19.35%
1 janv. 2010
1.192
-0.33
-21.69%
1 janv. 2011
0.858
-0.334
-28.03%
1 janv. 2012
0.744
-0.114
-13.26%
1 janv. 2013
1.065
+0.321
43.11%
1 janv. 2014
1.106
+0.041
3.83%
1 janv. 2015
1.204
+0.098
8.88%
1 janv. 2016
1.392
+0.188
15.63%

Classement des pays selon les statistiques actuelles par années