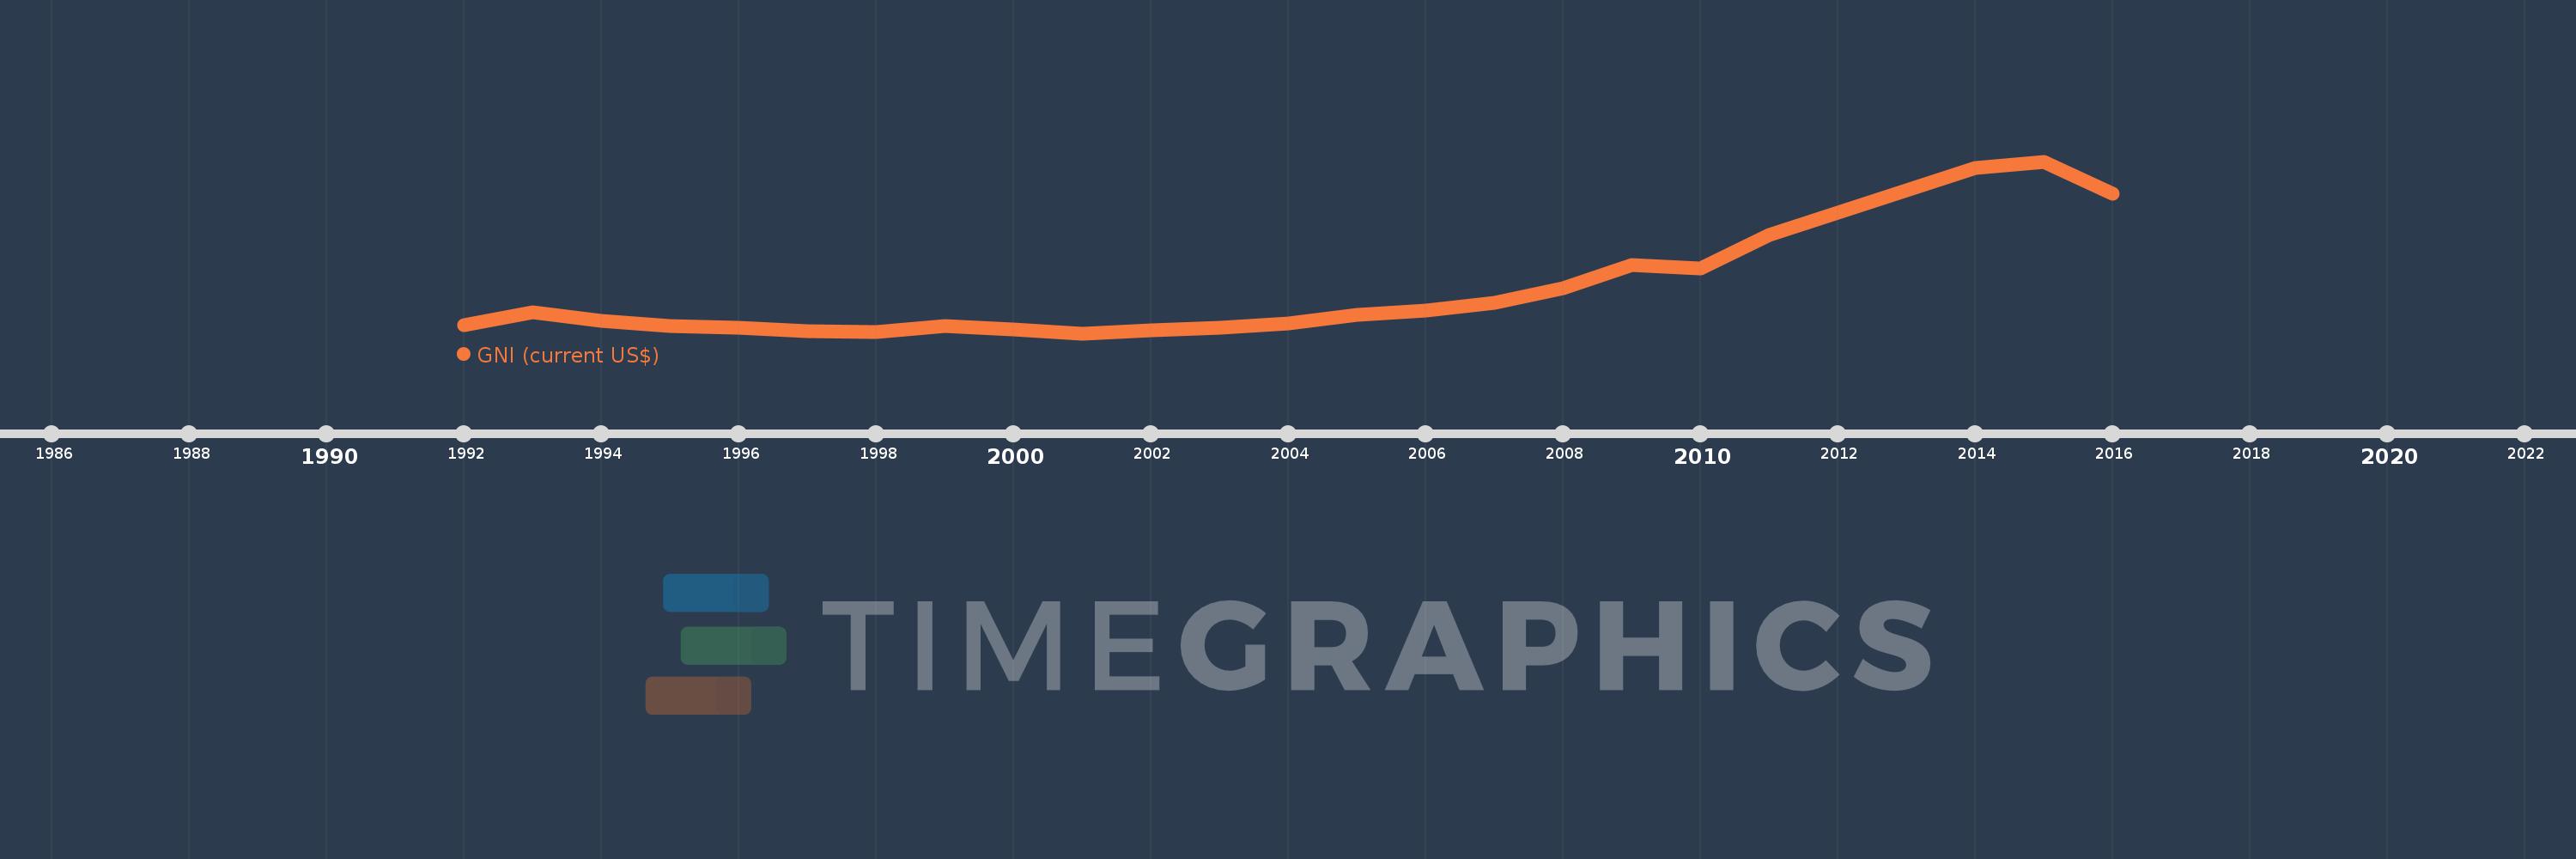
Cette échelle de temps montre un graphique de 1992 année à 2016 année Tajikistan. Les données jusqu'à 1991 année ne sont pas présentés. Quantité d'observations actuelles selon dates: 25.
Source (désignation):
Les indicateurs du développement mondiale
Source (organisation):
World Bank national accounts data, and OECD National Accounts data files.
Catégories:
Economy & Growth, External Debt
Dernière mise à jour
23 avr. 2017
Les indicateurs de changement de valeurs selon les années
En moyenne:
3.775 mds
Minimum:
824.422 mln.
1 janv. 2001
Maximum:
11.584 mds
1 janv. 2015
Pour la date d''observation
Valeur
Changement absolu
Le changement par rapport à la valeur précédente
1 janv. 1992
1.352 mds
+1.352 mds
0.0%
1 janv. 1993
2.157 mds
+804.667 mln.
59.52%
1 janv. 1994
1.628 mds
-528.388 mln.
-24.5%
1 janv. 1995
1.307 mds
-321.384 mln.
-19.74%
1 janv. 1996
1.182 mds
-124.401 mln.
-9.52%
1 janv. 1997
967.596 mln.
-214.898 mln.
-18.17%
1 janv. 1998
898.246 mln.
-69.35 mln.
-7.17%
1 janv. 1999
1.287 mds
+388.812 mln.
43.29%
1 janv. 2000
1.057 mds
-230.008 mln.
-17.87%
1 janv. 2001
824.422 mln.
-232.628 mln.
-22.01%
1 janv. 2002
1.03 mds
+205.666 mln.
24.95%
1 janv. 2003
1.164 mds
+134.23 mln.
13.03%
1 janv. 2004
1.464 mds
+299.552 mln.
25.73%
1 janv. 2005
2.0 mds
+535.697 mln.
36.59%
1 janv. 2006
2.234 mds
+234.209 mln.
11.71%
1 janv. 2007
2.729 mds
+495.097 mln.
22.16%
1 janv. 2008
3.634 mds
+904.73 mln.
33.15%
1 janv. 2009
5.108 mds
+1.475 mds
40.59%
1 janv. 2010
4.908 mds
-200.2 mln.
-3.92%
1 janv. 2011
6.977 mds
+2.069 mds
42.15%
1 janv. 2012
8.374 mds
+1.397 mds
20.03%
1 janv. 2013
9.757 mds
+1.382 mds
16.5%
1 janv. 2014
11.177 mds
+1.42 mds
14.56%
1 janv. 2015
11.584 mds
+407.257 mln.
3.64%
1 janv. 2016
9.584 mds
-1.999 mds
-17.26%
Classement des pays selon les statistiques actuelles par années