29
/fr/
fr
AIzaSyAYiBZKx7MnpbEhh9jyipgxe19OcubqV5w
April 1, 2024
255097
Swaziland
SWZ
true
2
1
Expenditure on primary as % of government expenditure on education (%)
2012,2011,2010,2009,2007,2006,2005,2004,2003,2002,2001,2000
Download
Bibliothèque de statistiques globales →Swaziland →

Expenditure on primary as % of government expenditure on education (%)

Cette statistique dans les autres pays:
AlbaniaAndorraAngolaAntigua and BarbudaArgentinaArmeniaArubaAustraliaAustriaBangladeshBarbadosBelgiumBelizeBeninBermudaBhutanBoliviaBotswanaBrazilBritish Virgin IslandsBrunei DarussalamBulgariaBurkina FasoBurundiCabo VerdeCambodiaCameroonCaribbean small statesCayman IslandsCentral African RepublicCentral Europe and the BalticsChadChileChinaColombiaComorosCongo, Dem. Rep.Congo, Rep.Costa RicaCote d'IvoireCubaCuracaoCyprusCzech RepublicDenmarkDjiboutiDominicaDominican RepublicEast Asia & PacificEast Asia & Pacific (IDA & IBRD countries)EcuadorEl SalvadorEquatorial GuineaEritreaEstoniaEthiopiaEuro areaEurope & Central AsiaEuropean UnionFijiFinlandFranceGabonGambia, TheGeorgiaGermanyGhanaGrenadaGuatemalaGuineaGuinea-BissauGuyanaHeavily indebted poor countries (HIPC)High incomeHondurasHong Kong SAR, ChinaHungaryIcelandIDA blendIDA totalIndiaIndonesiaIran, Islamic Rep.IrelandIsraelItalyJamaicaJapanJordanKenyaKiribatiKorea, Rep.KuwaitLao PDRLate-demographic dividendLatin America & Caribbean Latin America & Caribbean (excluding high income)Latin America & the Caribbean (IDA & IBRD countries)LatviaLeast developed countries: UN classificationLesothoLiberiaLiechtensteinLithuaniaLow incomeMacao SAR, ChinaMadagascarMalawiMalaysiaMaldivesMaliMaltaMarshall IslandsMauritaniaMauritiusMexicoMoldovaMonacoMongoliaMoroccoMozambiqueNamibiaNauruNepalNetherlandsNew ZealandNicaraguaNigerNorth AmericaNorwayOECD membersOmanOther small statesPakistanPalauPanamaParaguayPeruPhilippinesPolandPortugalPost-demographic dividendPre-demographic dividendPuerto RicoQatarRomaniaRwandaSamoaSan MarinoSao Tome and PrincipeSenegalSerbiaSeychellesSierra LeoneSingaporeSlovak RepublicSloveniaSmall statesSouth AfricaSouth AsiaSouth Asia (IDA & IBRD)South SudanSpainSri LankaSt. Kitts and NevisSt. LuciaSt. Vincent and the GrenadinesSub-Saharan Africa Sub-Saharan Africa (excluding high income)Sub-Saharan Africa (IDA & IBRD countries)SwazilandSwedenSwitzerlandSyrian Arab RepublicTanzaniaThailandTimor-LesteTogoTongaTrinidad and TobagoTunisiaTurks and Caicos IslandsUgandaUkraineUnited KingdomUnited StatesUruguayVanuatuVenezuela, RBVietnamWorldZambiaZimbabwe
La ligne de temps
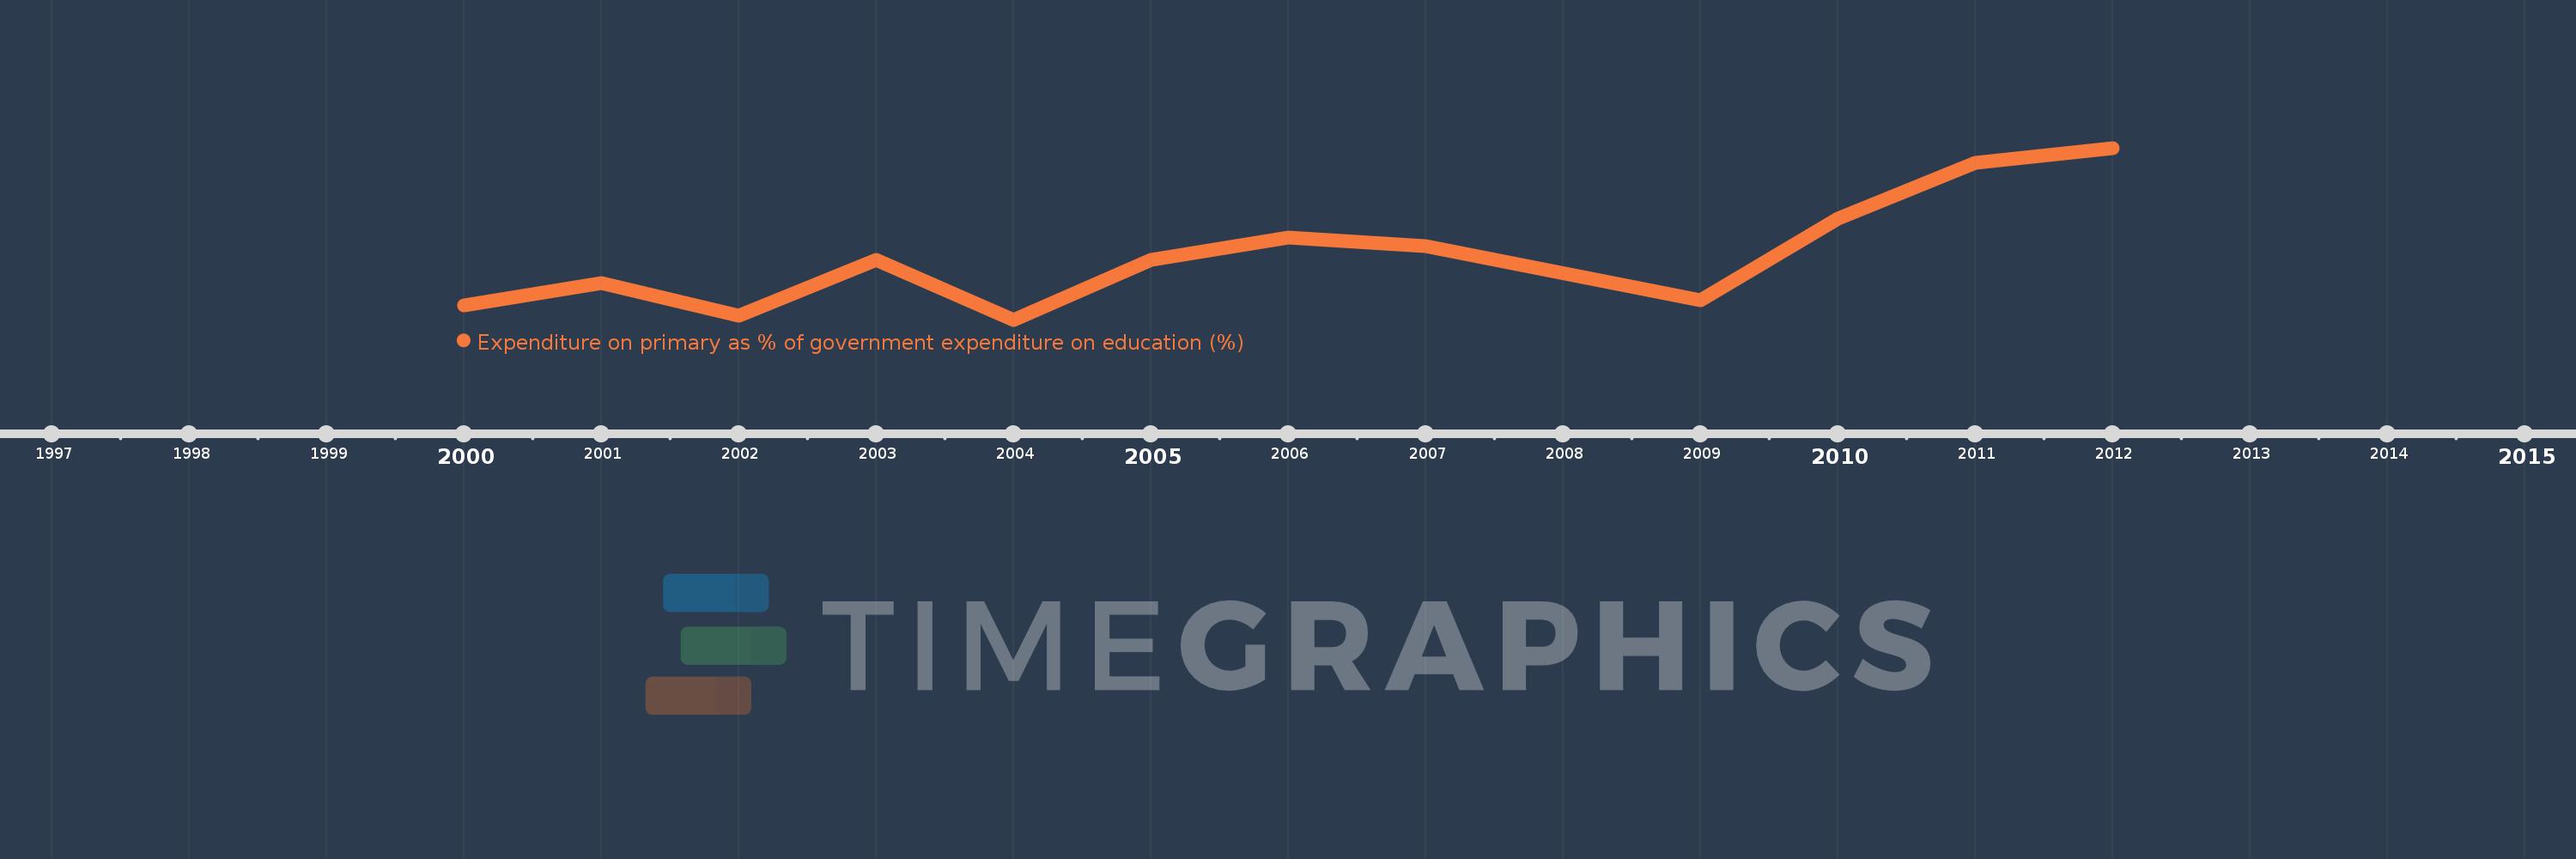
Cette échelle de temps montre un graphique de 2000 année à 2012 année Swaziland. Les données jusqu'à 1999 année ne sont pas présentés. Quantité d'observations actuelles selon dates: 12.
Source (désignation):
Les indicateurs du développement mondiale
Source (organisation):
UNESCO Institute for Statistics
Catégories:
Education
Dernière mise à jour
23 avr. 2017
Les indicateurs de changement de valeurs selon les années
En moyenne:
38.145
Minimum:
31.75
1 janv. 2004
Maximum:
48.669
1 janv. 2012
Pour la date d''observation
Valeur
Changement absolu
Le changement par rapport à la valeur précédente
1 janv. 2000
33.153
+33.153
0.0%
1 janv. 2001
35.359
+2.206
6.65%
1 janv. 2002
32.114
-3.245
-9.18%
1 janv. 2003
37.66
+5.546
17.27%
1 janv. 2004
31.75
-5.91
-15.69%
1 janv. 2005
37.655
+5.906
18.6%
1 janv. 2006
39.859
+2.204
5.85%
1 janv. 2007
38.992
-0.868
-2.18%
1 janv. 2009
33.63
-5.362
-13.75%
1 janv. 2010
41.737
+8.108
24.11%
1 janv. 2011
47.165
+5.427
13.0%
1 janv. 2012
48.669
+1.504
3.19%
Classement des pays selon les statistiques actuelles par années

Commentaires:

Envoyer
PremiumAbout & FeedbackUn accordConfidentialité
logo
© 2022 Selected Technologies LLC – Morgan Hill, California