29
/fr/
fr
AIzaSyAYiBZKx7MnpbEhh9jyipgxe19OcubqV5w
April 1, 2024
24077
Arab World
ARB
false
2
1
Firms that do not report all sales for tax purposes (% of firms)
2011,2010,2009,2008,2007,2004,2003
Download
Bibliothèque de statistiques globales →Arab World →

Firms that do not report all sales for tax purposes (% of firms)

Cette statistique dans les autres pays:
AlbaniaAlgeriaAngolaArab WorldArgentinaArmeniaAzerbaijanBelarusBeninBoliviaBosnia and HerzegovinaBotswanaBulgariaBurkina FasoBurundiCabo VerdeCambodiaCameroonCaribbean small statesCentral Europe and the BalticsChileChinaColombiaCongo, Dem. Rep.Congo, Rep.Costa RicaCote d'IvoireCroatiaCzech RepublicDominican RepublicEarly-demographic dividendEast Asia & PacificEast Asia & Pacific (excluding high income)East Asia & Pacific (IDA & IBRD countries)EcuadorEgypt, Arab Rep.El SalvadorEstoniaEthiopiaEuro areaEurope & Central AsiaEurope & Central Asia (excluding high income)Europe & Central Asia (IDA & IBRD countries)European UnionFragile and conflict affected situationsGabonGambia, TheGeorgiaGhanaGreeceGuatemalaGuineaGuinea-BissauGuyanaHeavily indebted poor countries (HIPC)High incomeHondurasHungaryIBRD onlyIDA & IBRD totalIDA blendIDA onlyIDA totalIndiaIndonesiaIrelandJamaicaJordanKazakhstanKenyaKorea, Rep.Kyrgyz RepublicLao PDRLate-demographic dividendLatin America & Caribbean Latin America & Caribbean (excluding high income)Latin America & the Caribbean (IDA & IBRD countries)LatviaLeast developed countries: UN classificationLebanonLiberiaLithuaniaLow & middle incomeLow incomeLower middle incomeMacedonia, FYRMadagascarMalawiMaliMauritaniaMauritiusMexicoMiddle East & North AfricaMiddle East & North Africa (excluding high income)Middle East & North Africa (IDA & IBRD countries)Middle incomeMoldovaMongoliaMontenegroMozambiqueNamibiaNicaraguaNigerNigeriaOECD membersOmanOther small statesPakistanPanamaParaguayPeruPolandPortugalPost-demographic dividendPre-demographic dividendRomaniaRussian FederationRwandaSenegalSerbiaSierra LeoneSlovak RepublicSloveniaSmall statesSouth AfricaSouth AsiaSouth Asia (IDA & IBRD)SpainSri LankaSub-Saharan Africa Sub-Saharan Africa (excluding high income)Sub-Saharan Africa (IDA & IBRD countries)SwazilandSyrian Arab RepublicTajikistanTanzaniaTurkeyUgandaUkraineUpper middle incomeUruguayUzbekistanVietnamWest Bank and GazaWorldYemen, Rep.Zambia
La ligne de temps
Cette échelle de temps montre un graphique de 2003 année à 2011 année Arab World. Les données jusqu'à 2002 année ne sont pas présentés. Quantité d'observations actuelles selon dates: 7.
Source (désignation):
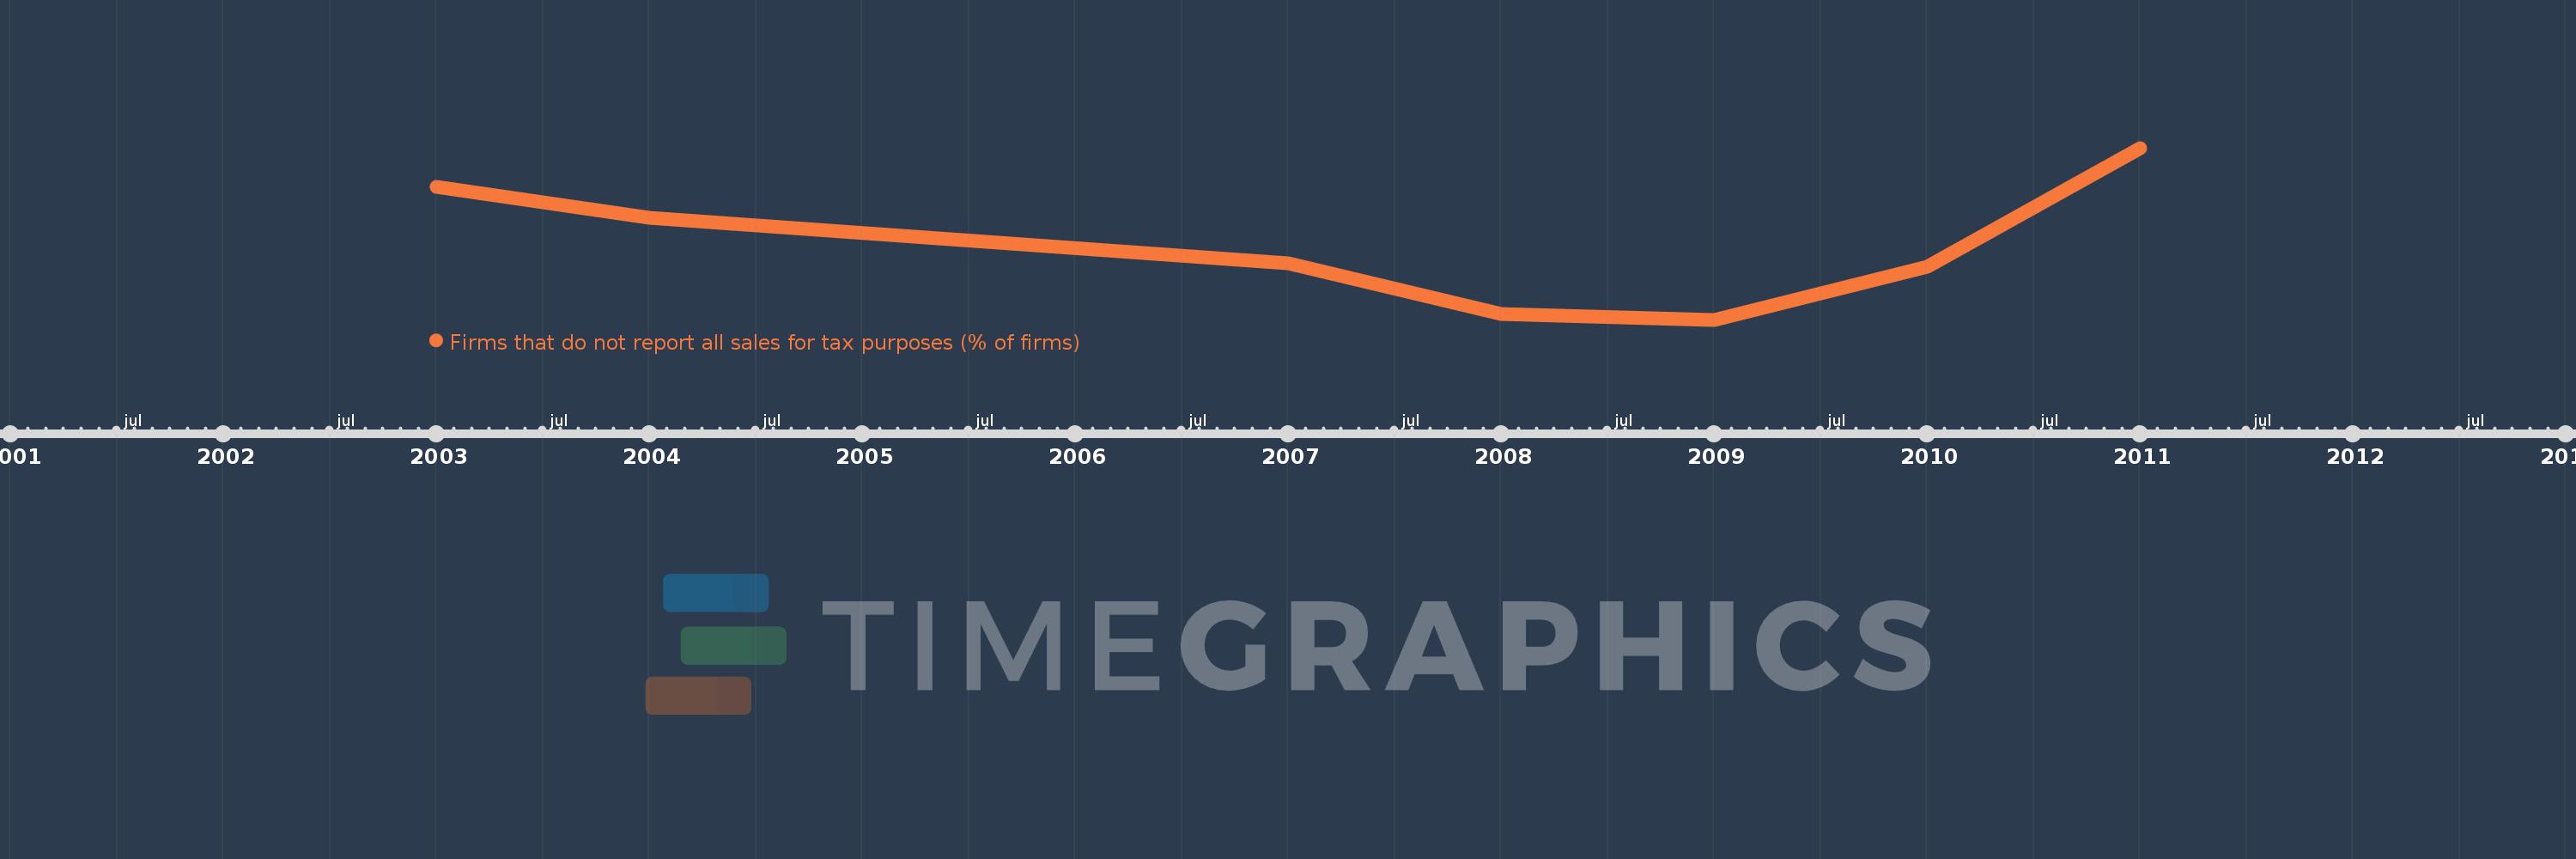
Les indicateurs du développement mondiale
Source (organisation):
World Bank, Enterprise Surveys (http://www.enterprisesurveys.org/).
Catégories:
Private Sector
Dernière mise à jour
23 avr. 2017
Les indicateurs de changement de valeurs selon les années
En moyenne:
52.694
Minimum:
30.0
1 janv. 2009
Maximum:
82.33
1 janv. 2011
Pour la date d''observation
Valeur
Changement absolu
Le changement par rapport à la valeur précédente
1 janv. 2003
70.37
+70.37
0.0%
1 janv. 2004
61.165
-9.205
-13.08%
1 janv. 2007
47.15
-14.015
-22.91%
1 janv. 2008
31.82
-15.33
-32.51%
1 janv. 2009
30.0
-1.82
-5.72%
1 janv. 2010
46.02
+16.02
53.4%
1 janv. 2011
82.33
+36.31
78.9%
Classement des pays selon les statistiques actuelles par années

Commentaires:

Envoyer
PremiumAbout & FeedbackUn accordConfidentialité
logo
© 2022 Selected Technologies LLC – Morgan Hill, California