30
/fr/
AIzaSyAYiBZKx7MnpbEhh9jyipgxe19OcubqV5w
April 1, 2024
237458
Serbia
SRB
true
2
1
Net bilateral aid flows from DAC donors, Sweden (current US$)
2015,2014,2013,2012,2011,2010,2009,2008,2007,2006,2005,2004,2003,2002,2001,2000,1999,1998,1997,1996,1995
Download
Bibliothèque de statistiques globales →Serbia →

Net bilateral aid flows from DAC donors, Sweden (current US$)

Cette statistique dans les autres pays:

AfghanistanAlbaniaAlgeriaAngolaAntigua and BarbudaArab WorldArgentinaArmeniaAzerbaijanBangladeshBelarusBelizeBeninBhutanBoliviaBosnia and HerzegovinaBotswanaBrazilBrunei DarussalamBulgariaBurkina FasoBurundiCabo VerdeCambodiaCameroonCaribbean small statesCentral African RepublicCentral Europe and the BalticsChadChileChinaColombiaComorosCongo, Dem. Rep.Congo, Rep.Costa RicaCote d'IvoireCroatiaCubaCyprusCzech RepublicDjiboutiDominicaDominican RepublicEast Asia & PacificEast Asia & Pacific (excluding high income)East Asia & Pacific (IDA & IBRD countries)EcuadorEgypt, Arab Rep.El SalvadorEquatorial GuineaEritreaEstoniaEthiopiaEuro areaEurope & Central AsiaEurope & Central Asia (excluding high income)Europe & Central Asia (IDA & IBRD countries)European UnionFijiFragile and conflict affected situationsGabonGambia, TheGeorgiaGhanaGrenadaGuatemalaGuineaGuinea-BissauGuyanaHaitiHeavily indebted poor countries (HIPC)High incomeHondurasHong Kong SAR, ChinaHungaryIBRD onlyIDA & IBRD totalIDA blendIDA onlyIDA totalIndiaIndonesiaIran, Islamic Rep.IraqIsraelJamaicaJordanKazakhstanKenyaKorea, Dem. People’s Rep.Korea, Rep.KosovoKuwaitKyrgyz RepublicLao PDRLatin America & Caribbean Latin America & Caribbean (excluding high income)Latin America & the Caribbean (IDA & IBRD countries)LatviaLeast developed countries: UN classificationLebanonLesothoLiberiaLibyaLithuaniaLow & middle incomeLow incomeLower middle incomeMacao SAR, ChinaMacedonia, FYRMadagascarMalawiMalaysiaMaldivesMaliMarshall IslandsMauritaniaMauritiusMexicoMicronesia, Fed. Sts.Middle East & North AfricaMiddle East & North Africa (excluding high income)Middle East & North Africa (IDA & IBRD countries)Middle incomeMoldovaMongoliaMontenegroMoroccoMozambiqueMyanmarNamibiaNepalNicaraguaNigerNigeriaOECD membersOther small statesPacific island small statesPakistanPanamaPapua New GuineaParaguayPeruPhilippinesPolandRomaniaRussian FederationRwandaSamoaSao Tome and PrincipeSaudi ArabiaSenegalSerbiaSeychellesSierra LeoneSingaporeSlovak RepublicSloveniaSmall statesSolomon IslandsSomaliaSouth AfricaSouth AsiaSouth Asia (IDA & IBRD)South SudanSri LankaSt. Kitts and NevisSt. LuciaSt. Vincent and the GrenadinesSub-Saharan Africa Sub-Saharan Africa (excluding high income)Sub-Saharan Africa (IDA & IBRD countries)SudanSurinameSwazilandSyrian Arab RepublicTajikistanTanzaniaThailandTimor-LesteTogoTrinidad and TobagoTunisiaTurkeyTurkmenistanUgandaUkraineUpper middle incomeUruguayUzbekistanVanuatuVenezuela, RBVietnamWest Bank and GazaWorldYemen, Rep.ZambiaZimbabwe

La ligne de temps

Cette échelle de temps montre un graphique de 1995 année à 2015 année Serbia. Les données jusqu'à 1994 année ne sont pas présentés. Quantité d'observations actuelles selon dates: 21.

Source (désignation):

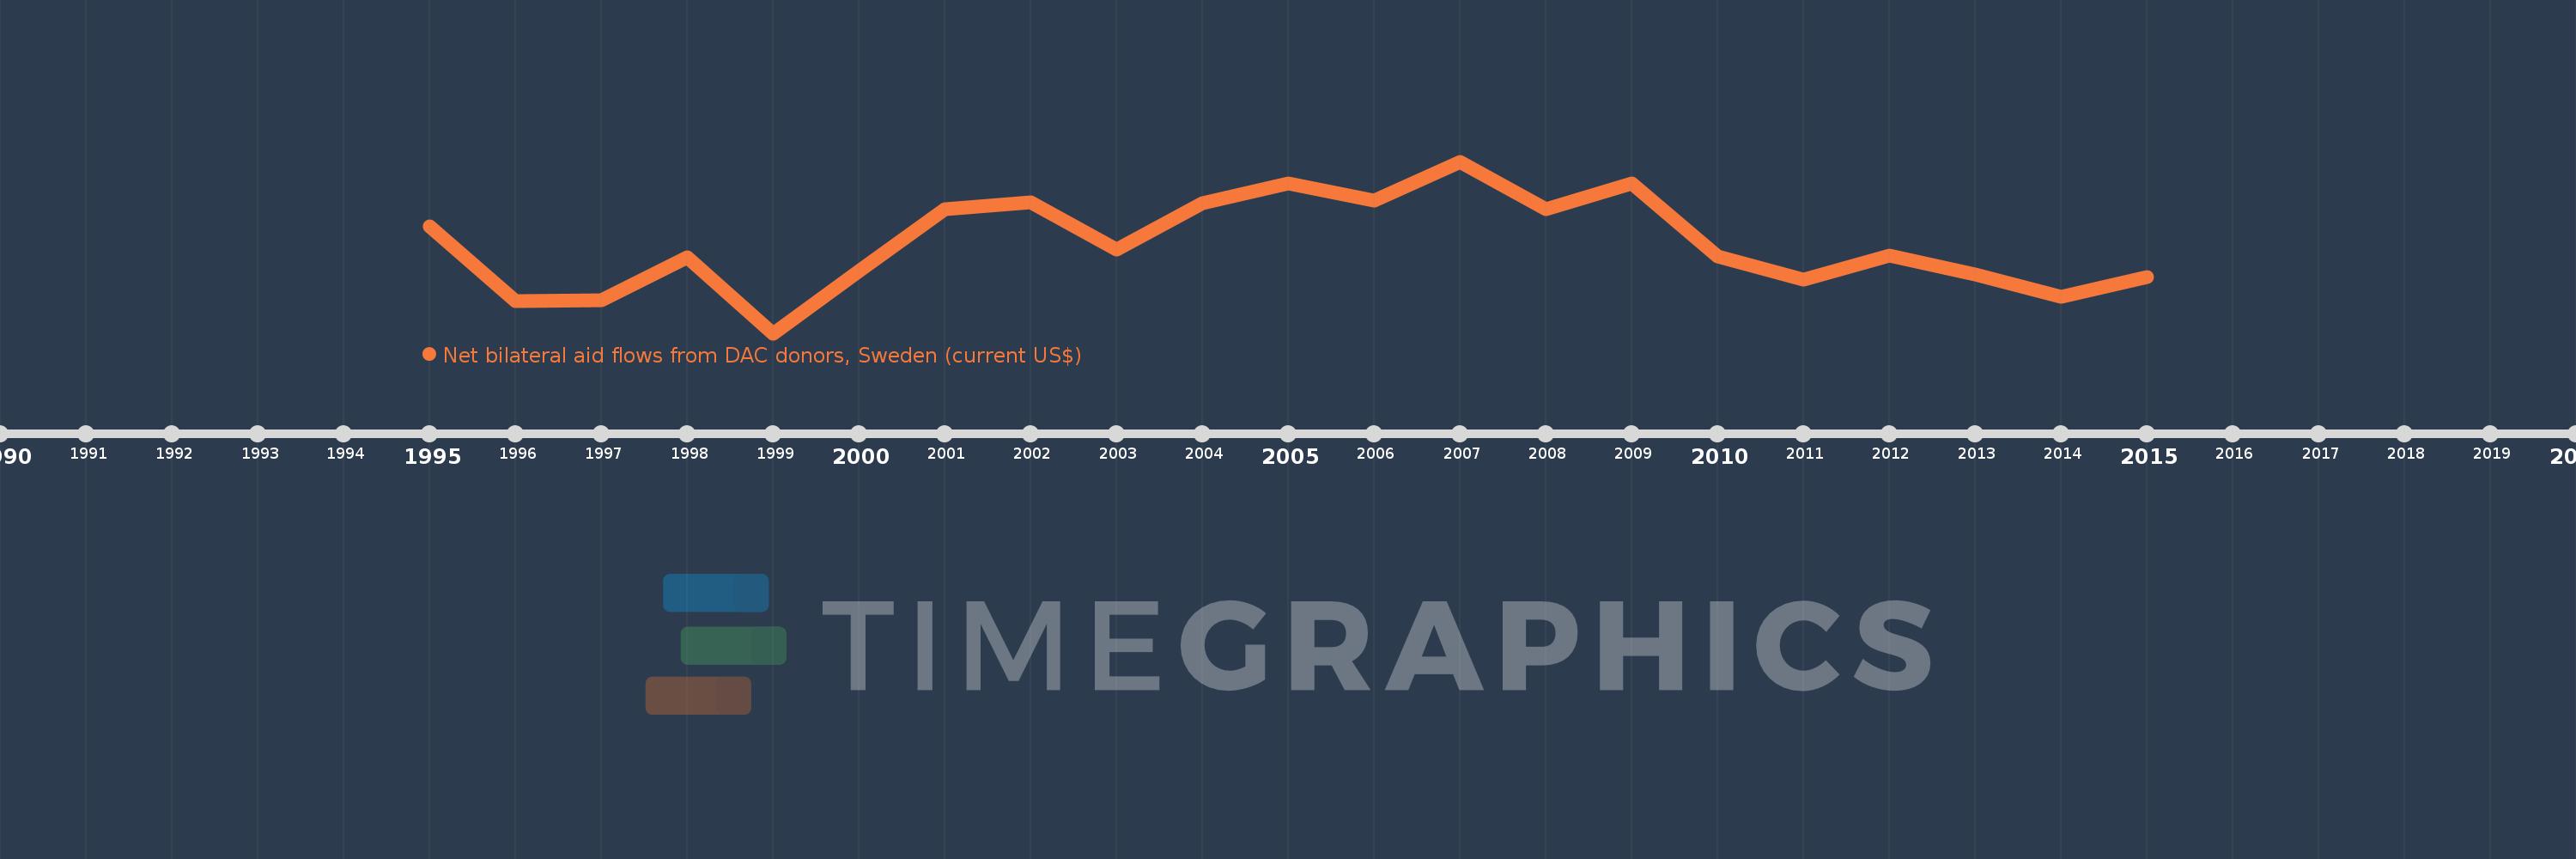
Les indicateurs du développement mondiale

Source (organisation):

Development Assistance Committee of the Organisation for Economic Co-operation and Development, Geographical Distribution of Financial Flows to Developing Countries, Development Co-operation Report, and International Development Statistics database. Data are available online at: www.oecd.org/dac/stats/idsonline.

Catégories:

Aid Effectiveness

Dernière mise à jour

23 avr. 2017

Les indicateurs de changement de valeurs selon les années

En moyenne:
25.604 mln.
Minimum:
5.56 mln.
1 janv. 1999
Maximum:
44.29 mln.
1 janv. 2007
Pour la date d''observation
Valeur
Changement absolu
Le changement par rapport à la valeur précédente
1 janv. 1995
29.58 mln.
+29.58 mln.
0.0%
1 janv. 1996
12.82 mln.
-16.76 mln.
-56.66%
1 janv. 1997
13.01 mln.
+190.0 milles
1.48%
1 janv. 1998
22.71 mln.
+9.7 mln.
74.56%
1 janv. 1999
5.56 mln.
-17.15 mln.
-75.52%
1 janv. 2000
19.62 mln.
+14.06 mln.
252.88%
1 janv. 2001
33.54 mln.
+13.92 mln.
70.95%
1 janv. 2002
35.04 mln.
+1.5 mln.
4.47%
1 janv. 2003
24.48 mln.
-10.56 mln.
-30.14%
1 janv. 2004
34.87 mln.
+10.39 mln.
42.44%
1 janv. 2005
39.43 mln.
+4.56 mln.
13.08%
1 janv. 2006
35.47 mln.
-3.96 mln.
-10.04%
1 janv. 2007
44.29 mln.
+8.82 mln.
24.87%
1 janv. 2008
33.47 mln.
-10.82 mln.
-24.43%
1 janv. 2009
39.43 mln.
+5.96 mln.
17.81%
1 janv. 2010
22.94 mln.
-16.49 mln.
-41.82%
1 janv. 2011
17.59 mln.
-5.35 mln.
-23.32%
1 janv. 2012
22.99 mln.
+5.4 mln.
30.7%
1 janv. 2013
18.84 mln.
-4.15 mln.
-18.05%
1 janv. 2014
13.71 mln.
-5.13 mln.
-27.23%
1 janv. 2015
18.3 mln.
+4.59 mln.
33.48%

Classement des pays selon les statistiques actuelles par années