29
/fr/
fr
AIzaSyAYiBZKx7MnpbEhh9jyipgxe19OcubqV5w
April 1, 2024
237137
Serbia
SRB
true
2
1
Grants, excluding technical cooperation (BoP, current US$)
2015,2014,2013,2012,2011,2010,2009,2008,2007,2006,2005,2004,2003,2002,2001,2000,1999,1998,1997,1996,1995
Download
Bibliothèque de statistiques globales →Serbia →

Grants, excluding technical cooperation (BoP, current US$)

Cette statistique dans les autres pays:
AfghanistanAlbaniaAlgeriaAngolaAntigua and BarbudaArgentinaArmeniaArubaAzerbaijanBahamas, TheBahrainBangladeshBarbadosBelarusBelizeBeninBermudaBhutanBoliviaBosnia and HerzegovinaBotswanaBrazilBrunei DarussalamBurkina FasoBurundiCabo VerdeCambodiaCameroonCayman IslandsCentral African RepublicChadChileChinaColombiaComorosCongo, Dem. Rep.Congo, Rep.Costa RicaCote d'IvoireCroatiaCubaCyprusDjiboutiDominicaDominican RepublicEcuadorEgypt, Arab Rep.El SalvadorEquatorial GuineaEritreaEthiopiaFijiFrench PolynesiaGabonGambia, TheGeorgiaGhanaGibraltarGrenadaGuatemalaGuineaGuinea-BissauGuyanaHaitiHondurasHong Kong SAR, ChinaIndiaIndonesiaIran, Islamic Rep.IraqIsraelJamaicaJordanKazakhstanKenyaKiribatiKorea, Dem. People’s Rep.Korea, Rep.KosovoKuwaitKyrgyz RepublicLao PDRLebanonLesothoLiberiaLibyaLow & middle incomeMacedonia, FYRMadagascarMalawiMalaysiaMaldivesMaliMaltaMarshall IslandsMauritaniaMauritiusMexicoMicronesia, Fed. Sts.MoldovaMongoliaMontenegroMoroccoMozambiqueMyanmarNamibiaNepalNew CaledoniaNicaraguaNigerNigeriaOmanPakistanPalauPanamaPapua New GuineaParaguayPeruPhilippinesQatarRwandaSamoaSao Tome and PrincipeSaudi ArabiaSenegalSerbiaSeychellesSierra LeoneSingaporeSloveniaSolomon IslandsSomaliaSouth AfricaSouth SudanSri LankaSt. Kitts and NevisSt. LuciaSt. Vincent and the GrenadinesSudanSurinameSwazilandSyrian Arab RepublicTajikistanTanzaniaThailandTimor-LesteTogoTongaTrinidad and TobagoTunisiaTurkeyTurkmenistanTurks and Caicos IslandsTuvaluUgandaUkraineUnited Arab EmiratesUruguayUzbekistanVanuatuVenezuela, RBVietnamWest Bank and GazaYemen, Rep.ZambiaZimbabwe
La ligne de temps
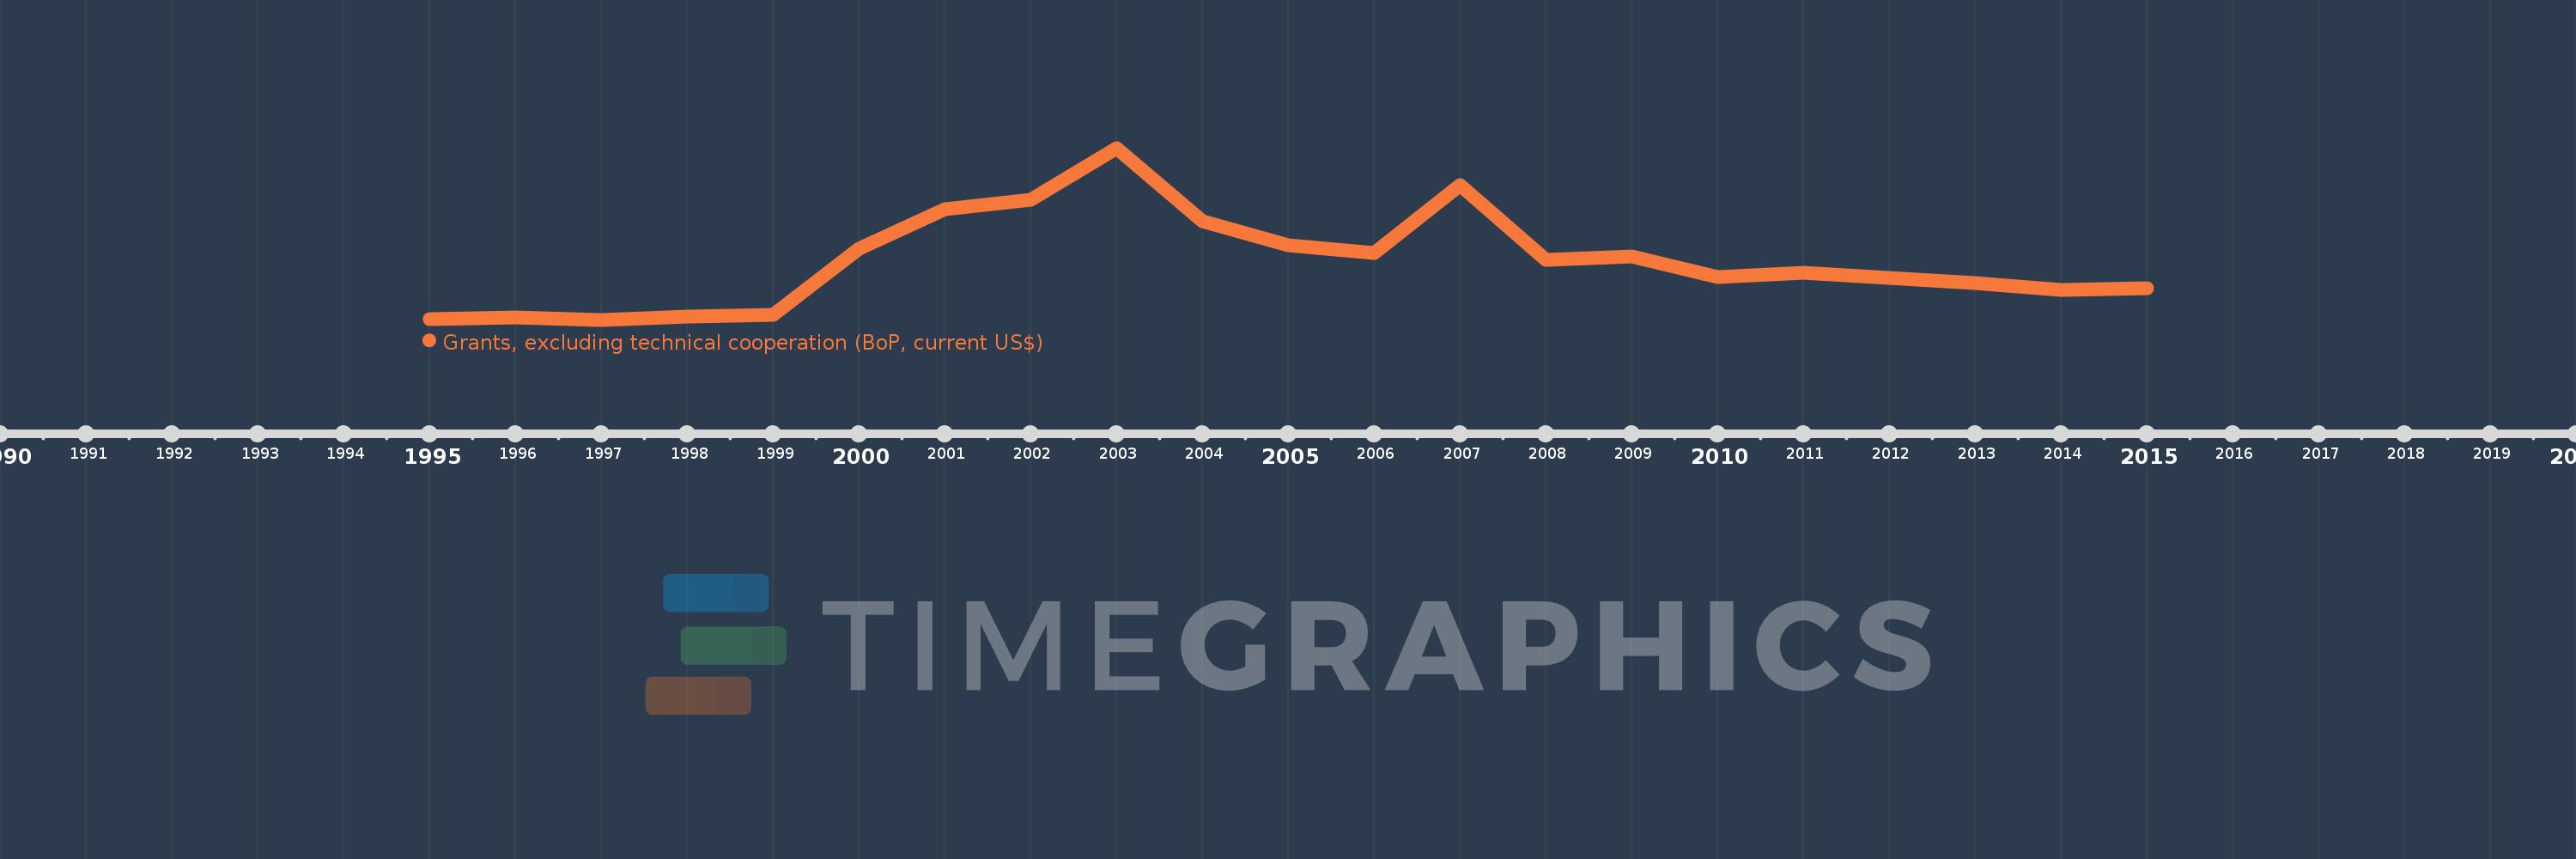
Cette échelle de temps montre un graphique de 1995 année à 2015 année Serbia. Les données jusqu'à 1994 année ne sont pas présentés. Quantité d'observations actuelles selon dates: 21.
Source (désignation):
Les indicateurs du développement mondiale
Source (organisation):
World Bank, International Debt Statistics, and OECD.
Catégories:
Economy & Growth, External Debt, Aid Effectiveness
Dernière mise à jour
23 avr. 2017
Les indicateurs de changement de valeurs selon les années
En moyenne:
542.661 mln.
Minimum:
38.57 mln.
1 janv. 1997
Maximum:
1.539 mds
1 janv. 2003
Pour la date d''observation
Valeur
Changement absolu
Le changement par rapport à la valeur précédente
1 janv. 1995
42.21 mln.
+42.21 mln.
0.0%
1 janv. 1996
58.1 mln.
+15.89 mln.
37.65%
1 janv. 1997
38.57 mln.
-19.53 mln.
-33.61%
1 janv. 1998
63.5 mln.
+24.93 mln.
64.64%
1 janv. 1999
79.99 mln.
+16.49 mln.
25.97%
1 janv. 2000
662.35 mln.
+582.36 mln.
728.04%
1 janv. 2001
1.001 mds
+338.35 mln.
51.08%
1 janv. 2002
1.089 mds
+88.36 mln.
8.83%
1 janv. 2003
1.539 mds
+450.24 mln.
41.34%
1 janv. 2004
900.47 mln.
-638.83 mln.
-41.5%
1 janv. 2005
692.55 mln.
-207.92 mln.
-23.09%
1 janv. 2006
620.54 mln.
-72.01 mln.
-10.4%
1 janv. 2007
1.215 mds
+594.83 mln.
95.86%
1 janv. 2008
558.78 mln.
-656.59 mln.
-54.02%
1 janv. 2009
588.23 mln.
+29.45 mln.
5.27%
1 janv. 2010
415.06 mln.
-173.17 mln.
-29.44%
1 janv. 2011
450.0 mln.
+34.94 mln.
8.42%
1 janv. 2012
404.2 mln.
-45.8 mln.
-10.18%
1 janv. 2013
360.68 mln.
-43.52 mln.
-10.77%
1 janv. 2014
302.56 mln.
-58.12 mln.
-16.11%
1 janv. 2015
313.66 mln.
+11.1 mln.
3.67%
Classement des pays selon les statistiques actuelles par années

Commentaires:

Envoyer
PremiumAbout & FeedbackUn accordConfidentialité
logo
© 2022 Selected Technologies LLC – Morgan Hill, California