29
/fr/
fr
AIzaSyAYiBZKx7MnpbEhh9jyipgxe19OcubqV5w
April 1, 2024
224501
Poland
POL
true
2
1
Adjusted net national income (annual % growth)
2015,2014,2013,2012,2011,2010,2009,2008,2007,2006,2005,2004,2003,2002,2001,2000,1999,1998,1997,1996,1995,1994,1993
Download
Bibliothèque de statistiques globales →Poland →

Adjusted net national income (annual % growth)

Cette statistique dans les autres pays:
AlbaniaAlgeriaAngolaArab WorldArgentinaArmeniaAustraliaAustriaAzerbaijanBahamas, TheBahrainBangladeshBarbadosBelarusBelgiumBelizeBeninBhutanBoliviaBotswanaBrazilBrunei DarussalamBulgariaBurkina FasoBurundiCabo VerdeCambodiaCameroonCanadaCaribbean small statesCentral Europe and the BalticsChadChileChinaColombiaComorosCongo, Dem. Rep.Congo, Rep.Costa RicaCote d'IvoireCroatiaCubaCyprusCzech RepublicDenmarkDjiboutiDominican RepublicEarly-demographic dividendEcuadorEgypt, Arab Rep.El SalvadorEquatorial GuineaEritreaEstoniaEthiopiaEuro areaEurope & Central AsiaEurope & Central Asia (excluding high income)Europe & Central Asia (IDA & IBRD countries)European UnionFijiFinlandFranceGabonGambia, TheGeorgiaGermanyGhanaGreeceGuatemalaGuineaGuinea-BissauHaitiHeavily indebted poor countries (HIPC)High incomeHondurasHungaryIBRD onlyIcelandIDA & IBRD totalIDA blendIDA onlyIDA totalIndiaIndonesiaIran, Islamic Rep.IrelandIsraelItalyJamaicaJapanJordanKazakhstanKenyaKorea, Rep.KuwaitKyrgyz RepublicLao PDRLatin America & Caribbean Latin America & Caribbean (excluding high income)Latin America & the Caribbean (IDA & IBRD countries)LatviaLeast developed countries: UN classificationLebanonLiberiaLibyaLithuaniaLow & middle incomeLow incomeLower middle incomeLuxembourgMacedonia, FYRMadagascarMalawiMalaysiaMaliMauritaniaMauritiusMexicoMiddle East & North AfricaMiddle East & North Africa (excluding high income)Middle East & North Africa (IDA & IBRD countries)Middle incomeMoldovaMongoliaMoroccoMozambiqueMyanmarNamibiaNepalNetherlandsNew ZealandNicaraguaNigerNigeriaNorth AmericaNorwayOECD membersOmanOther small statesPakistanPanamaPapua New GuineaParaguayPeruPhilippinesPolandPortugalPost-demographic dividendPre-demographic dividendQatarRomaniaRussian FederationRwandaSamoaSaudi ArabiaSenegalSeychellesSierra LeoneSingaporeSlovak RepublicSloveniaSmall statesSouth AfricaSouth AsiaSouth Asia (IDA & IBRD)SpainSri LankaSub-Saharan Africa Sub-Saharan Africa (excluding high income)Sub-Saharan Africa (IDA & IBRD countries)SudanSurinameSwazilandSwedenSwitzerlandSyrian Arab RepublicTajikistanTanzaniaThailandTogoTrinidad and TobagoTunisiaTurkeyTurkmenistanUgandaUkraineUnited Arab EmiratesUnited KingdomUnited StatesUruguayUzbekistanVanuatuVenezuela, RBVietnamWorldZambiaZimbabwe
La ligne de temps
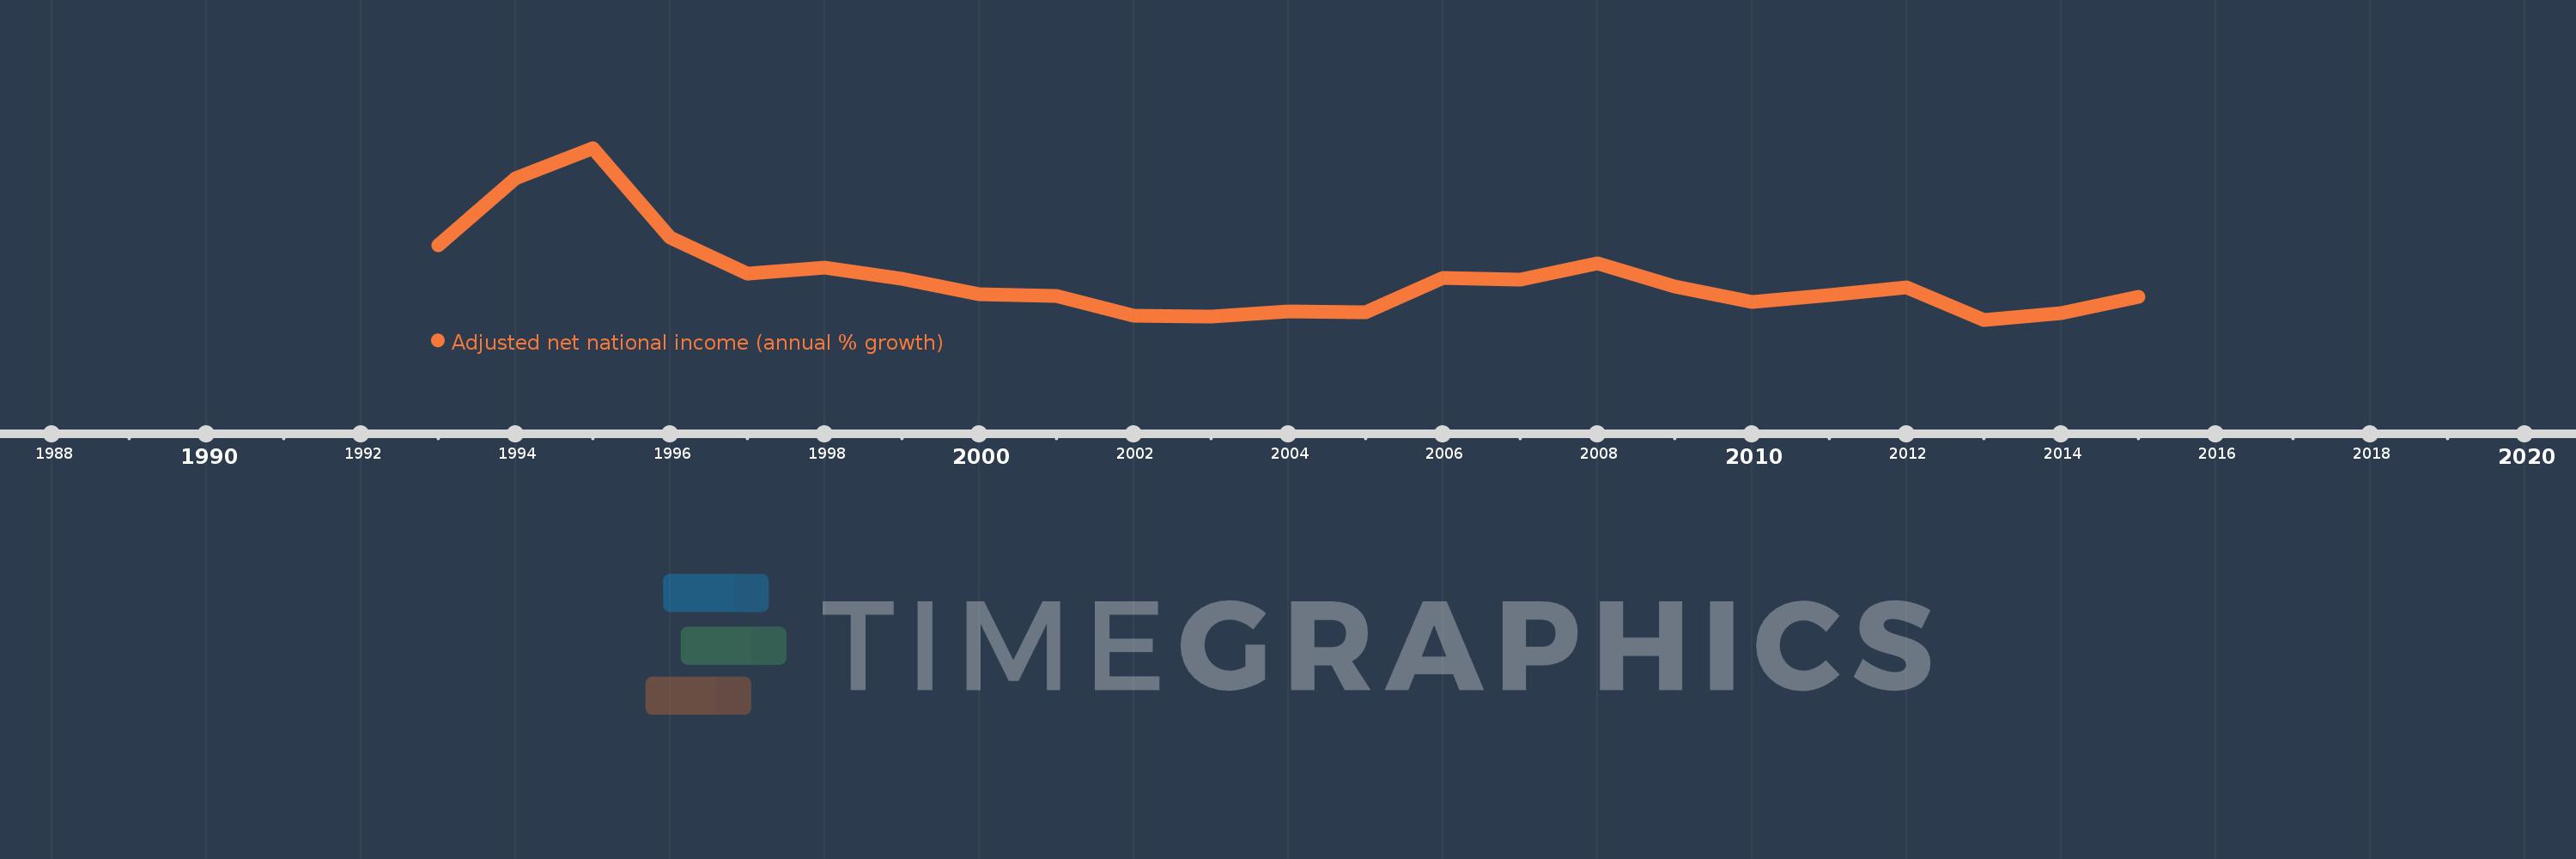
Cette échelle de temps montre un graphique de 1993 année à 2015 année Poland. Les données jusqu'à 1992 année ne sont pas présentés. Quantité d'observations actuelles selon dates: 23.
Source (désignation):
Les indicateurs du développement mondiale
Source (organisation):
World Bank staff estimates based on sources and methods in World Bank's "The Changing Wealth of Nations: Measuring Sustainable Development in the New Millennium" (2011).
Catégories:
Economy & Growth
Dernière mise à jour
23 avr. 2017
Les indicateurs de changement de valeurs selon les années
En moyenne:
6.052
Minimum:
0.939
1 janv. 2013
Maximum:
22.043
1 janv. 1995
Pour la date d''observation
Valeur
Changement absolu
Le changement par rapport à la valeur précédente
1 janv. 1993
10.107
+10.107
0.0%
1 janv. 1994
18.336
+8.229
81.42%
1 janv. 1995
22.043
+3.707
20.22%
1 janv. 1996
11.03
-11.013
-49.96%
1 janv. 1997
6.579
-4.451
-40.35%
1 janv. 1998
7.368
+0.789
11.99%
1 janv. 1999
5.938
-1.43
-19.4%
1 janv. 2000
4.056
-1.882
-31.7%
1 janv. 2001
3.84
-0.216
-5.33%
1 janv. 2002
1.423
-2.417
-62.95%
1 janv. 2003
1.357
-0.066
-4.62%
1 janv. 2004
1.933
+0.576
42.46%
1 janv. 2005
1.907
-0.026
-1.37%
1 janv. 2006
6.101
+4.195
220.01%
1 janv. 2007
5.875
-0.227
-3.71%
1 janv. 2008
7.907
+2.032
34.6%
1 janv. 2009
5.029
-2.878
-36.4%
1 janv. 2010
3.154
-1.875
-37.28%
1 janv. 2011
3.93
+0.776
24.6%
1 janv. 2012
4.865
+0.934
23.78%
1 janv. 2013
0.939
-3.926
-80.7%
1 janv. 2014
1.707
+0.768
81.82%
1 janv. 2015
3.763
+2.056
120.45%
Classement des pays selon les statistiques actuelles par années

Commentaires:

Envoyer
PremiumAbout & FeedbackUn accordConfidentialité
logo
© 2022 Selected Technologies LLC – Morgan Hill, California