33
/fr/
AIzaSyB4mHJ5NPEv-XzF7P6NDYXjlkCWaeKw5bc
November 1, 2025
223620
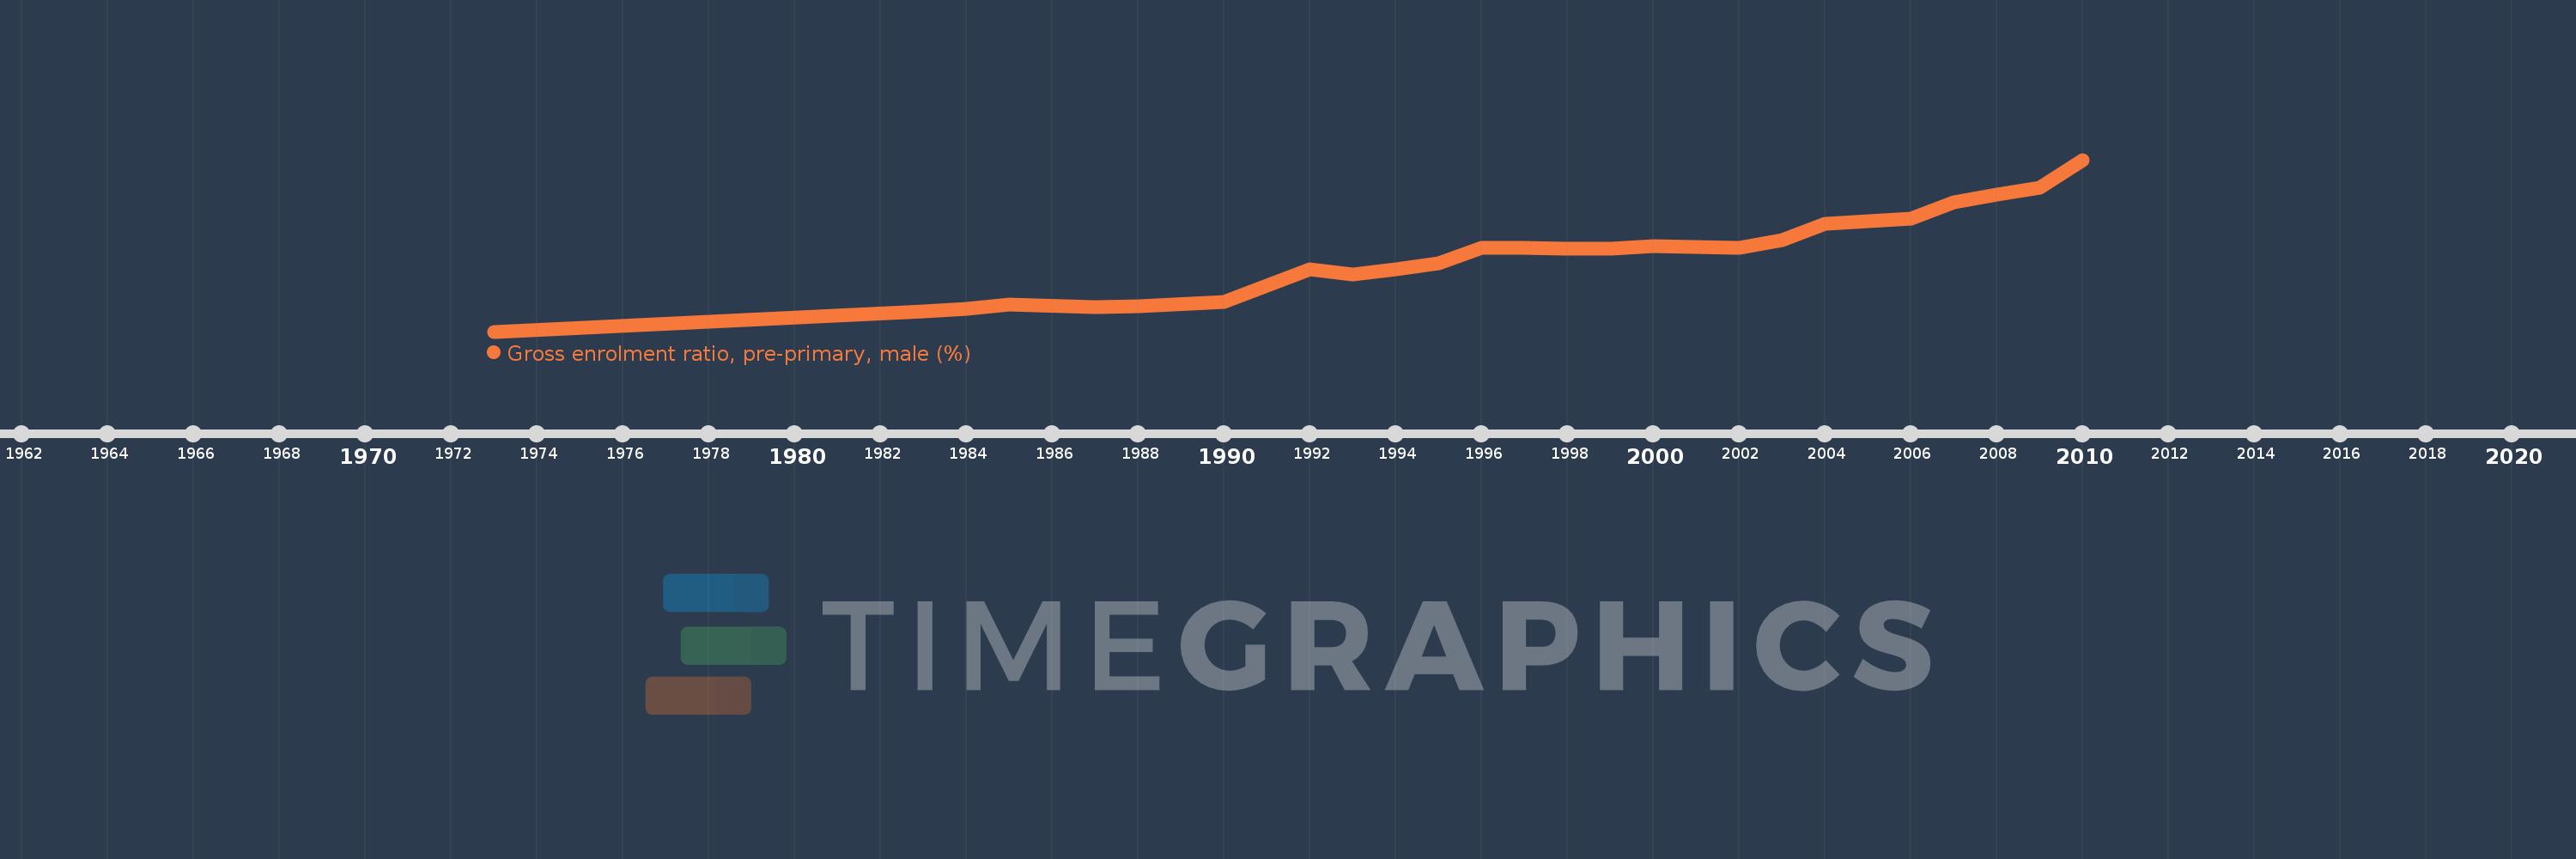
Philippines
PHL
true
2
1
Gross enrolment ratio, pre-primary, male (%)
2010,2009,2008,2007,2006,2005,2004,2003,2002,2000,1999,1998,1997,1996,1995,1994,1993,1992,1990,1988,1987,1985,1984,1983,1973