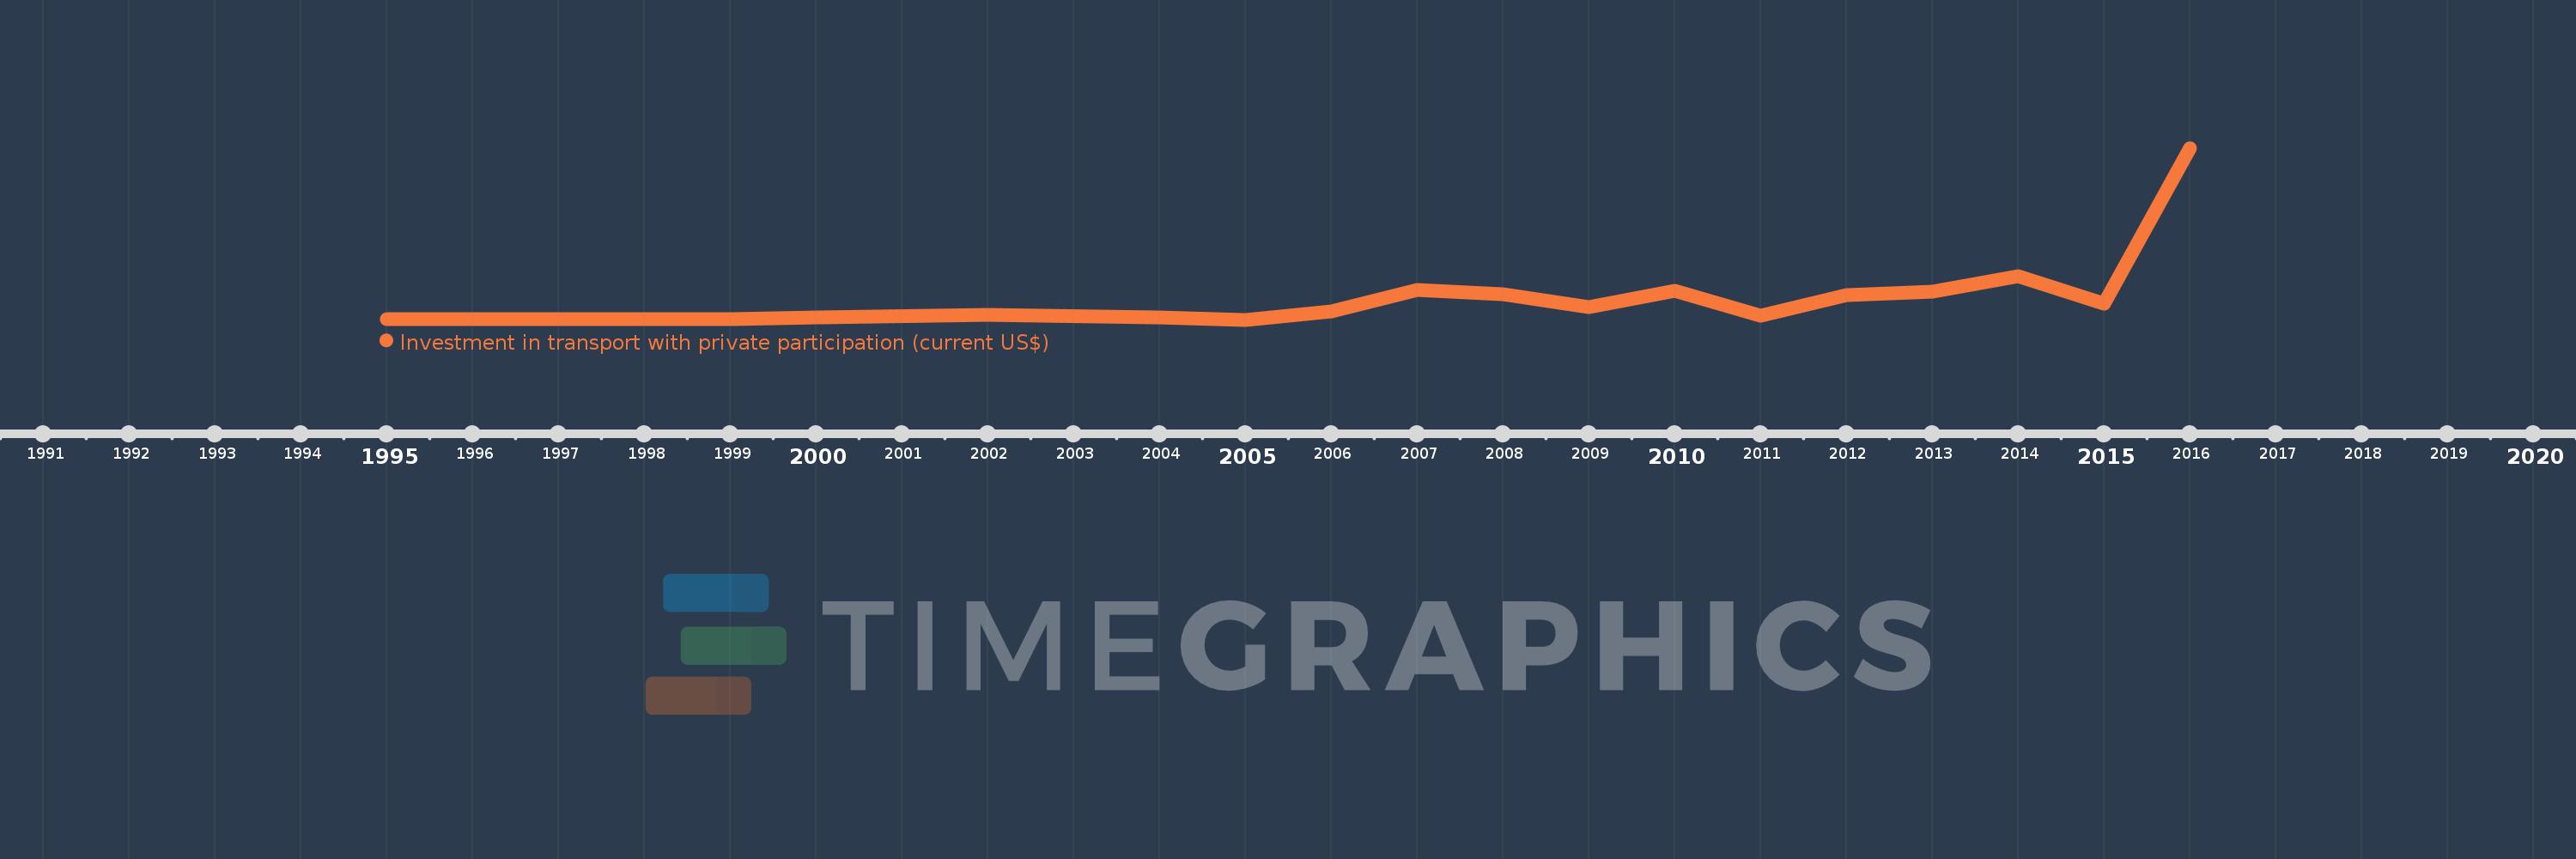
Cette échelle de temps montre un graphique de 1995 année à 2016 année Peru. Les données jusqu'à 1994 année ne sont pas présentés. Quantité d'observations actuelles selon dates: 17.
Source (désignation):
Les indicateurs du développement mondiale
Source (organisation):
World Bank, Private Participation in Infrastructure Project Database (http://ppi.worldbank.org).
Catégories:
Infrastructure, Private Sector
Dernière mise à jour
23 avr. 2017
Les indicateurs de changement de valeurs selon les années
En moyenne:
817.884 mln.
Minimum:
0.0
1 janv. 2005
Maximum:
5.925 mds
1 janv. 2016
Pour la date d''observation
Valeur
Changement absolu
Le changement par rapport à la valeur précédente
1 janv. 1995
6.6 mln.
+6.6 mln.
0.0%
1 janv. 1999
8.0 mln.
+1.4 mln.
21.21%
1 janv. 2000
78.3 mln.
+70.3 mln.
878.75%
1 janv. 2002
164.5 mln.
+86.2 mln.
110.09%
1 janv. 2004
75.0 mln.
-89.5 mln.
-54.41%
1 janv. 2005
0.0
-75.0 mln.
-100.0%
1 janv. 2006
283.0 mln.
+283.0 mln.
%
1 janv. 2007
1.02 mds
+737.0 mln.
260.42%
1 janv. 2008
875.8 mln.
-144.2 mln.
-14.14%
1 janv. 2009
439.0 mln.
-436.8 mln.
-49.87%
1 janv. 2010
987.83 mln.
+548.83 mln.
125.02%
1 janv. 2011
127.0 mln.
-860.83 mln.
-87.14%
1 janv. 2012
860.0 mln.
+733.0 mln.
577.17%
1 janv. 2013
983.0 mln.
+123.0 mln.
14.3%
1 janv. 2014
1.506 mds
+523.0 mln.
53.2%
1 janv. 2015
565.0 mln.
-941.0 mln.
-62.48%
1 janv. 2016
5.925 mds
+5.36 mds
948.67%
Classement des pays selon les statistiques actuelles par années