29
/fr/
fr
AIzaSyAYiBZKx7MnpbEhh9jyipgxe19OcubqV5w
April 1, 2024
217480
Palau
PLW
true
2
1
GDP (current LCU)
2016,2015,2014,2013,2012,2011,2010,2009,2008,2007,2006,2005,2004,2003,2002,2001,2000,1999,1998,1997,1996,1995,1994,1993,1992,1991
Download
Bibliothèque de statistiques globales →Palau →

GDP (current LCU)

Cette statistique dans les autres pays:
AfghanistanAlbaniaAlgeriaAndorraAngolaAntigua and BarbudaArgentinaArmeniaArubaAustraliaAustriaAzerbaijanBahamas, TheBahrainBangladeshBarbadosBelarusBelgiumBelizeBeninBermudaBhutanBoliviaBosnia and HerzegovinaBotswanaBrazilBrunei DarussalamBulgariaBurkina FasoBurundiCabo VerdeCambodiaCameroonCanadaCayman IslandsCentral African RepublicChadChannel IslandsChileChinaColombiaComorosCongo, Dem. Rep.Congo, Rep.Costa RicaCote d'IvoireCroatiaCubaCyprusCzech RepublicDenmarkDjiboutiDominicaDominican RepublicEcuadorEgypt, Arab Rep.El SalvadorEquatorial GuineaEritreaEstoniaEthiopiaFaroe IslandsFijiFinlandFranceFrench PolynesiaGabonGambia, TheGeorgiaGermanyGhanaGreeceGreenlandGrenadaGuatemalaGuineaGuinea-BissauGuyanaHaitiHondurasHong Kong SAR, ChinaHungaryIcelandIndiaIndonesiaIran, Islamic Rep.IraqIrelandIsle of ManIsraelItalyJamaicaJapanJordanKazakhstanKenyaKiribatiKorea, Rep.KosovoKuwaitKyrgyz RepublicLao PDRLatviaLebanonLesothoLiberiaLibyaLiechtensteinLithuaniaLuxembourgMacao SAR, ChinaMacedonia, FYRMadagascarMalawiMalaysiaMaldivesMaliMaltaMarshall IslandsMauritaniaMauritiusMexicoMicronesia, Fed. Sts.MoldovaMonacoMongoliaMontenegroMoroccoMozambiqueMyanmarNamibiaNauruNepalNetherlandsNew CaledoniaNew ZealandNicaraguaNigerNigeriaNorwayOmanPakistanPalauPanamaPapua New GuineaParaguayPeruPhilippinesPolandPortugalPuerto RicoQatarRomaniaRussian FederationRwandaSamoaSan MarinoSao Tome and PrincipeSaudi ArabiaSenegalSerbiaSeychellesSierra LeoneSingaporeSint Maarten (Dutch part)Slovak RepublicSloveniaSolomon IslandsSomaliaSouth AfricaSouth SudanSpainSri LankaSt. Kitts and NevisSt. LuciaSt. Vincent and the GrenadinesSudanSurinameSwazilandSwedenSwitzerlandSyrian Arab RepublicTajikistanTanzaniaThailandTimor-LesteTogoTongaTrinidad and TobagoTunisiaTurkeyTurkmenistanTuvaluUgandaUkraineUnited Arab EmiratesUnited KingdomUnited StatesUruguayUzbekistanVanuatuVenezuela, RBVietnamVirgin Islands (U.S.)West Bank and GazaYemen, Rep.ZambiaZimbabwe
La ligne de temps
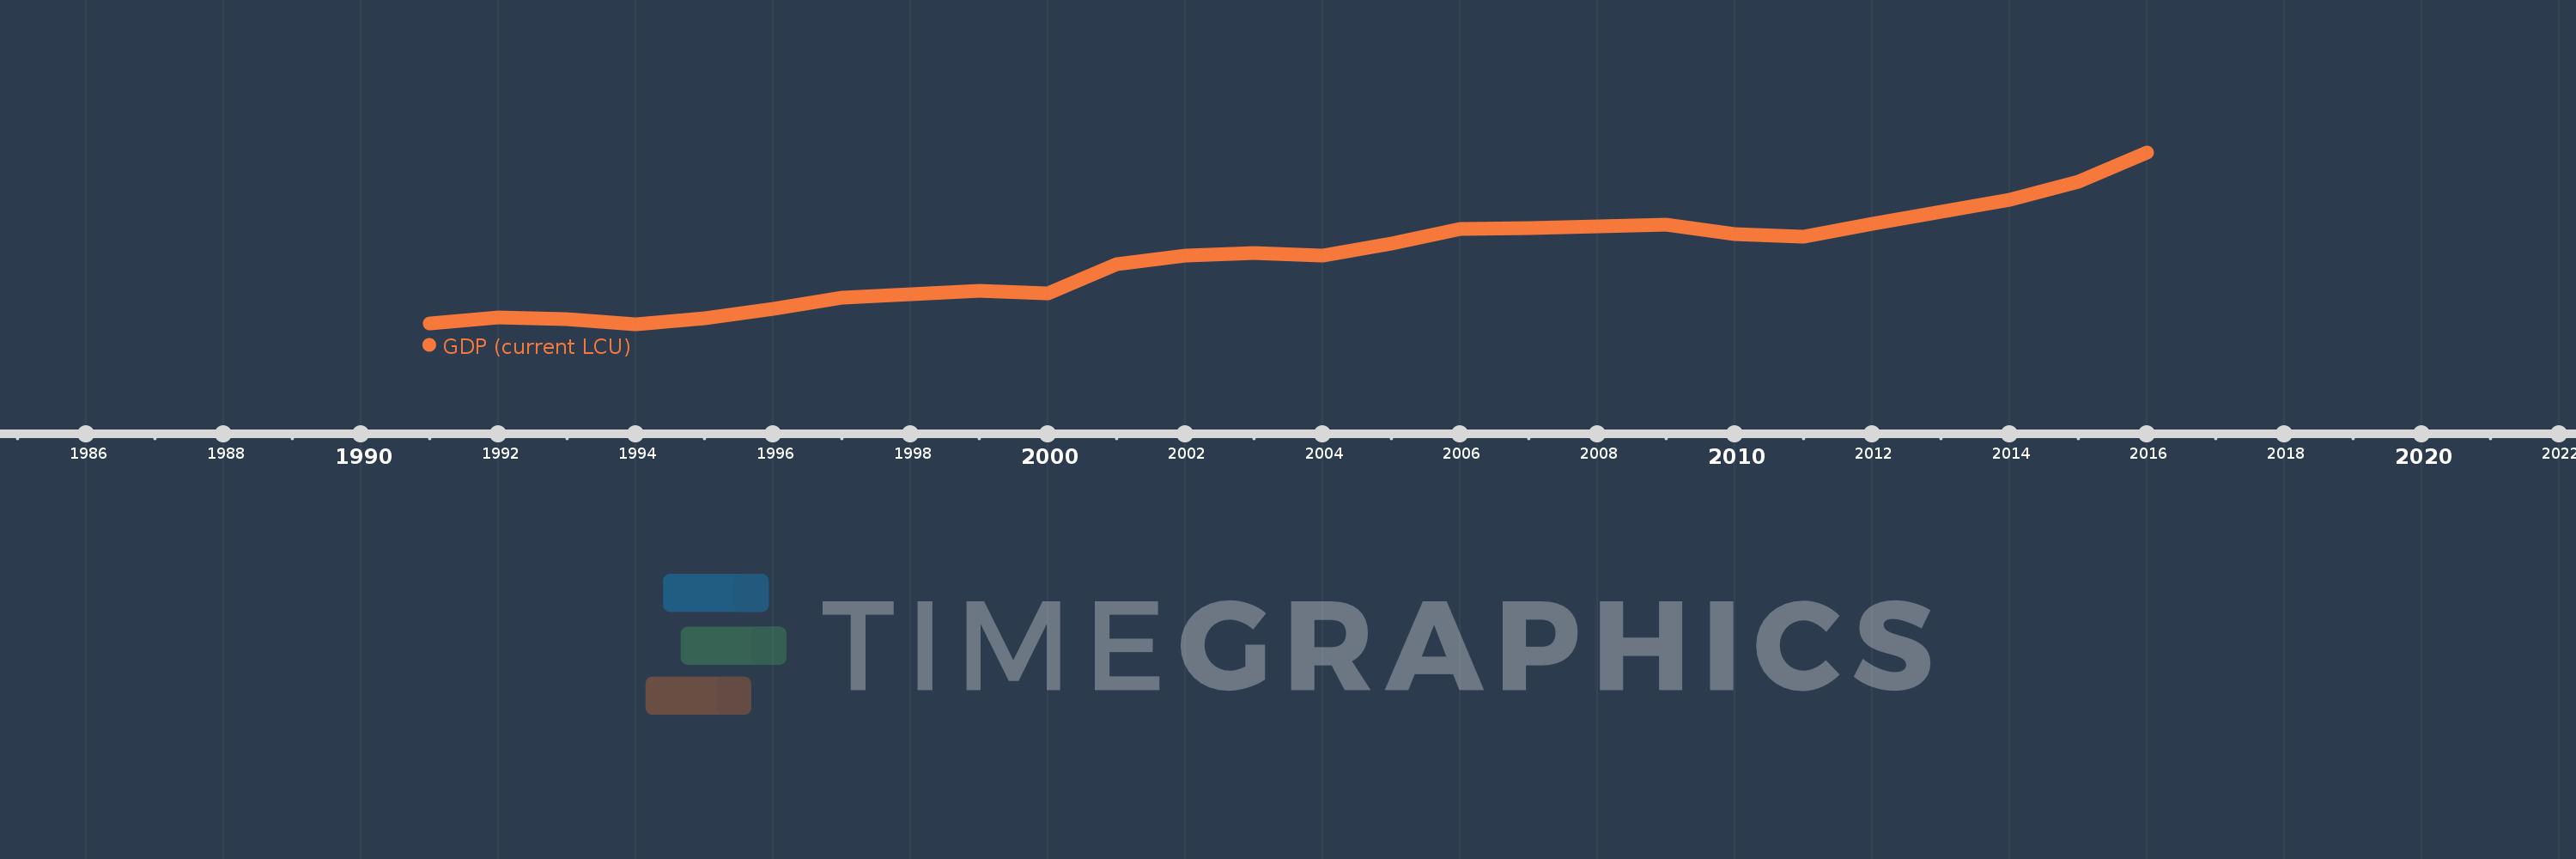
Cette échelle de temps montre un graphique de 1991 année à 2016 année Palau. Les données jusqu'à 1990 année ne sont pas présentés. Quantité d'observations actuelles selon dates: 26.
Source (désignation):
Les indicateurs du développement mondiale
Source (organisation):
World Bank national accounts data, and OECD National Accounts data files.
Catégories:
Economy & Growth
Dernière mise à jour
23 avr. 2017
Les indicateurs de changement de valeurs selon les années
En moyenne:
157.365 mln.
Minimum:
75.907 mln.
1 janv. 1994
Maximum:
287.4 mln.
1 janv. 2016
Pour la date d''observation
Valeur
Changement absolu
Le changement par rapport à la valeur précédente
1 janv. 1991
76.888 mln.
+76.888 mln.
0.0%
1 janv. 1992
83.855 mln.
+6.967 mln.
9.06%
1 janv. 1993
82.451 mln.
-1.404 mln.
-1.67%
1 janv. 1994
75.907 mln.
-6.544 mln.
-7.94%
1 janv. 1995
83.527 mln.
+7.62 mln.
10.04%
1 janv. 1996
95.237 mln.
+11.71 mln.
14.02%
1 janv. 1997
108.203 mln.
+12.966 mln.
13.61%
1 janv. 1998
113.213 mln.
+5.01 mln.
4.63%
1 janv. 1999
117.32 mln.
+4.107 mln.
3.63%
1 janv. 2000
113.485 mln.
-3.835 mln.
-3.27%
1 janv. 2001
149.3 mln.
+35.815 mln.
31.56%
1 janv. 2002
160.0 mln.
+10.7 mln.
7.17%
1 janv. 2003
163.5 mln.
+3.5 mln.
2.19%
1 janv. 2004
159.9 mln.
-3.6 mln.
-2.2%
1 janv. 2005
175.3 mln.
+15.4 mln.
9.63%
1 janv. 2006
193.3 mln.
+18.0 mln.
10.27%
1 janv. 2007
194.7 mln.
+1.4 mln.
0.72%
1 janv. 2008
196.0 mln.
+1.3 mln.
0.67%
1 janv. 2009
198.1 mln.
+2.1 mln.
1.07%
1 janv. 2010
186.4 mln.
-11.7 mln.
-5.91%
1 janv. 2011
183.8 mln.
-2.6 mln.
-1.39%
1 janv. 2012
199.9 mln.
+16.1 mln.
8.76%
1 janv. 2013
214.2 mln.
+14.3 mln.
7.15%
1 janv. 2014
228.7 mln.
+14.5 mln.
6.77%
1 janv. 2015
250.9 mln.
+22.2 mln.
9.71%
1 janv. 2016
287.4 mln.
+36.5 mln.
14.55%
Classement des pays selon les statistiques actuelles par années

Commentaires:

Envoyer
PremiumAbout & FeedbackUn accordConfidentialité
logo
© 2022 Selected Technologies LLC – Morgan Hill, California