30
/fr/
AIzaSyAYiBZKx7MnpbEhh9jyipgxe19OcubqV5w
April 1, 2024
215604
Oman
OMN
true
2
1
Net lending (+) / net borrowing (-) (% of GDP)
2014,2013,2012,2011,2010,2009,2008,2007,2006,2005,2004,2003,2002,2001,2000,1999,1998,1997,1996,1995,1994,1993,1992,1991
Download
Bibliothèque de statistiques globales →Oman →

Net lending (+) / net borrowing (-) (% of GDP)

Cette statistique dans les autres pays:

AfghanistanAlbaniaAlgeriaAngolaAntigua and BarbudaArmeniaAustraliaAustriaAzerbaijanBahamas, TheBahrainBangladeshBarbadosBelarusBelgiumBelizeBhutanBoliviaBosnia and HerzegovinaBrazilBurundiCabo VerdeCambodiaCanadaCaribbean small statesCentral African RepublicCentral Europe and the BalticsChileCongo, Dem. Rep.Congo, Rep.Costa RicaCote d'IvoireCroatiaCyprusCzech RepublicDenmarkDominicaDominican RepublicEarly-demographic dividendEgypt, Arab Rep.El SalvadorEquatorial GuineaEstoniaEthiopiaEuro areaEurope & Central AsiaEurope & Central Asia (excluding high income)Europe & Central Asia (IDA & IBRD countries)European UnionFijiFinlandFranceGambia, TheGeorgiaGermanyGreeceGuatemalaHigh incomeHondurasHungaryIcelandIDA blendIndiaIndonesiaIran, Islamic Rep.IraqIrelandIsraelItalyJamaicaKazakhstanKiribatiKorea, Rep.Kyrgyz RepublicLao PDRLatin America & Caribbean Latin America & Caribbean (excluding high income)Latin America & the Caribbean (IDA & IBRD countries)LatviaLebanonLithuaniaLower middle incomeLuxembourgMacao SAR, ChinaMacedonia, FYRMadagascarMalawiMaldivesMaliMaltaMauritiusMexicoMicronesia, Fed. Sts.Middle East & North Africa (excluding high income)Middle East & North Africa (IDA & IBRD countries)MoldovaMongoliaMoroccoMozambiqueNamibiaNepalNetherlandsNew ZealandNicaraguaNigeriaNorth AmericaNorwayOECD membersOmanOther small statesPacific island small statesPakistanParaguayPeruPhilippinesPolandPortugalPost-demographic dividendQatarRomaniaRussian FederationRwandaSamoaSan MarinoSao Tome and PrincipeSenegalSerbiaSierra LeoneSingaporeSlovak RepublicSmall statesSolomon IslandsSouth AfricaSouth AsiaSouth Asia (IDA & IBRD)SpainSri LankaSub-Saharan Africa Sub-Saharan Africa (excluding high income)Sub-Saharan Africa (IDA & IBRD countries)SurinameSwazilandSwedenSwitzerlandSyrian Arab RepublicThailandTimor-LesteTrinidad and TobagoTurkeyUgandaUkraineUnited Arab EmiratesUnited KingdomUnited StatesUruguayVanuatuVietnamWest Bank and GazaWorldYemen, Rep.Zimbabwe

La ligne de temps

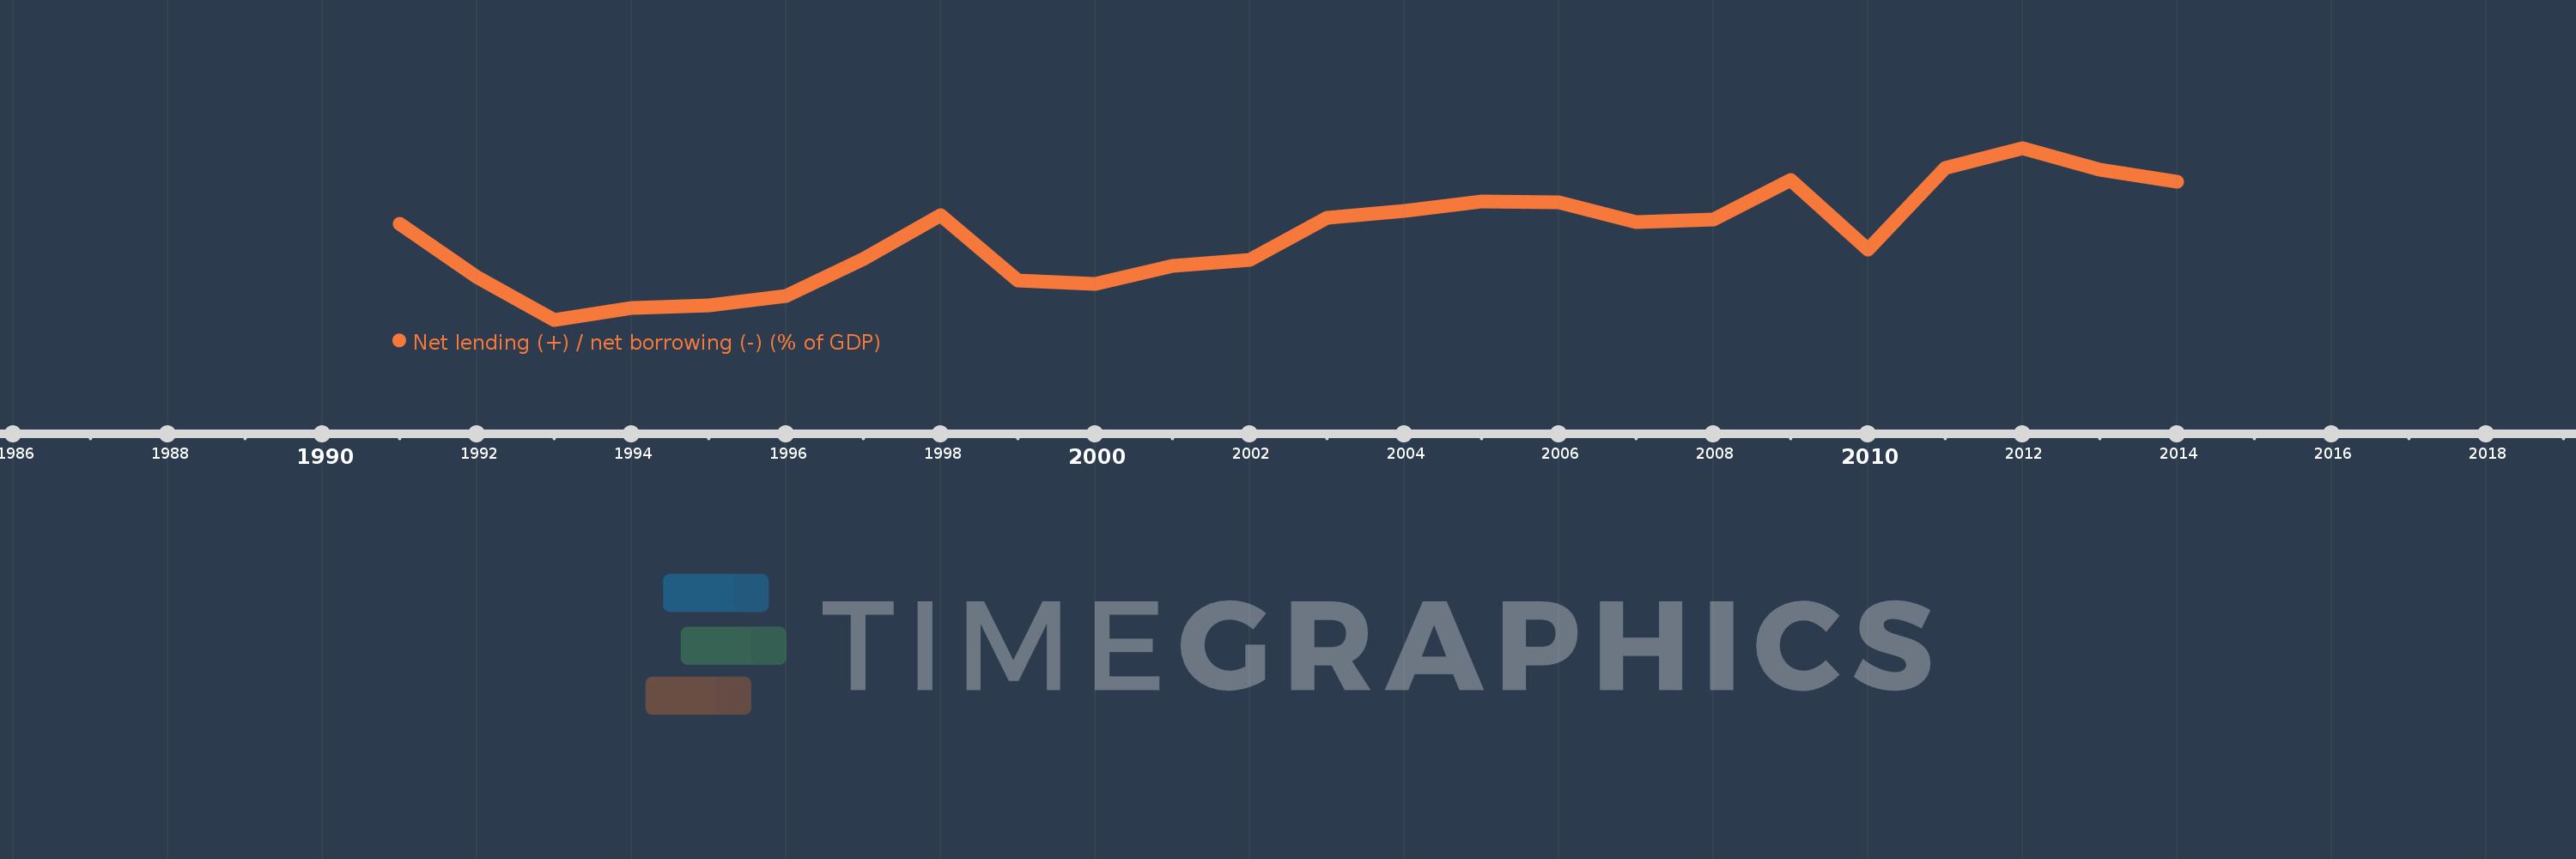
Cette échelle de temps montre un graphique de 1991 année à 2014 année Oman. Les données jusqu'à 1990 année ne sont pas présentés. Quantité d'observations actuelles selon dates: 24.

Source (désignation):

Les indicateurs du développement mondiale

Source (organisation):

International Monetary Fund, Government Finance Statistics Yearbook and data files.

Catégories:

Public Sector

Dernière mise à jour

23 avr. 2017

Les indicateurs de changement de valeurs selon les années

En moyenne:
-1.774
Minimum:
-11.723
1 janv. 1993
Maximum:
8.705
1 janv. 2012
Pour la date d''observation
Valeur
Changement absolu
Le changement par rapport à la valeur précédente
1 janv. 1991
-0.318
-0.318
0.0%
1 janv. 1992
-6.666
-6.348
1.99 milles%
1 janv. 1993
-11.723
-5.057
75.86%
1 janv. 1994
-10.294
+1.429
-12.19%
1 janv. 1995
-9.987
+0.307
-2.98%
1 janv. 1996
-8.858
+1.129
-11.31%
1 janv. 1997
-4.525
+4.333
-48.92%
1 janv. 1998
0.659
+5.183
-114.55%
1 janv. 1999
-7.103
-7.762
-1.18 milles%
1 janv. 2000
-7.483
-0.38
5.34%
1 janv. 2001
-5.277
+2.206
-29.48%
1 janv. 2002
-4.557
+0.72
-13.65%
1 janv. 2003
0.394
+4.95
-108.64%
1 janv. 2004
1.248
+0.854
216.87%
1 janv. 2005
2.319
+1.071
85.83%
1 janv. 2006
2.222
-0.097
-4.16%
1 janv. 2007
-0.078
-2.301
-103.52%
1 janv. 2008
0.151
+0.229
-292.65%
1 janv. 2009
4.871
+4.721
3.13 milles%
1 janv. 2010
-3.385
-8.256
-169.48%
1 janv. 2011
6.355
+9.739
-287.75%
1 janv. 2012
8.705
+2.351
36.99%
1 janv. 2013
6.089
-2.616
-30.05%
1 janv. 2014
4.668
-1.421
-23.34%

Classement des pays selon les statistiques actuelles par années