33
/fr/
AIzaSyAYiBZKx7MnpbEhh9jyipgxe19OcubqV5w
August 1, 2025
209354
New Zealand
NZL
true
2
1
Government expenditure per tertiary student as % of GDP per capita (%)
2015,2013,2012,2011,2010,2009,2008,2007,2006,2005,2004,2003,2002,2000
Download
Bibliothèque de statistiques globales →New Zealand →

Government expenditure per tertiary student as % of GDP per capita (%)

Cette statistique dans les autres pays:

AlbaniaAndorraAngolaAntigua and BarbudaArgentinaArmeniaArubaAustraliaAustriaAzerbaijanBangladeshBarbadosBelarusBelgiumBelizeBeninBermudaBhutanBoliviaBotswanaBrazilBrunei DarussalamBulgariaBurkina FasoBurundiCabo VerdeCambodiaCameroonCanadaCaribbean small statesCentral African RepublicCentral Europe and the BalticsChadChileChinaColombiaComorosCongo, Dem. Rep.Congo, Rep.Costa RicaCote d'IvoireCroatiaCubaCuracaoCyprusCzech RepublicDenmarkDjiboutiEast Asia & PacificEast Asia & Pacific (excluding high income)East Asia & Pacific (IDA & IBRD countries)EcuadorEl SalvadorEritreaEstoniaEthiopiaEuro areaEurope & Central AsiaEurope & Central Asia (excluding high income)Europe & Central Asia (IDA & IBRD countries)European UnionFijiFinlandFranceGambia, TheGeorgiaGhanaGreeceGuatemalaGuineaGuyanaHeavily indebted poor countries (HIPC)High incomeHondurasHong Kong SAR, ChinaHungaryIBRD onlyIcelandIDA blendIndiaIndonesiaIran, Islamic Rep.IrelandIsraelItalyJamaicaJapanKazakhstanKenyaKorea, Rep.KuwaitKyrgyz RepublicLao PDRLate-demographic dividendLatin America & Caribbean Latin America & Caribbean (excluding high income)Latin America & the Caribbean (IDA & IBRD countries)LatviaLeast developed countries: UN classificationLebanonLesothoLiberiaLibyaLiechtensteinLithuaniaLow incomeMacao SAR, ChinaMacedonia, FYRMadagascarMalawiMalaysiaMaliMaltaMarshall IslandsMauritaniaMauritiusMexicoMoldovaMongoliaMoroccoMozambiqueNamibiaNepalNetherlandsNew ZealandNigerNorth AmericaNorwayOECD membersOmanOther small statesPakistanPalauPanamaParaguayPeruPhilippinesPolandPortugalPost-demographic dividendPuerto RicoRomaniaRussian FederationRwandaSamoaSan MarinoSao Tome and PrincipeSaudi ArabiaSenegalSerbiaSeychellesSingaporeSlovak RepublicSloveniaSmall statesSouth AfricaSouth AsiaSouth Asia (IDA & IBRD)SpainSri LankaSt. LuciaSwazilandSwedenSwitzerlandSyrian Arab RepublicTajikistanTanzaniaThailandTimor-LesteTogoTongaTunisiaTurkeyUgandaUkraineUnited KingdomUnited StatesUruguayVanuatuVenezuela, RBVietnamWorldZimbabwe

La ligne de temps

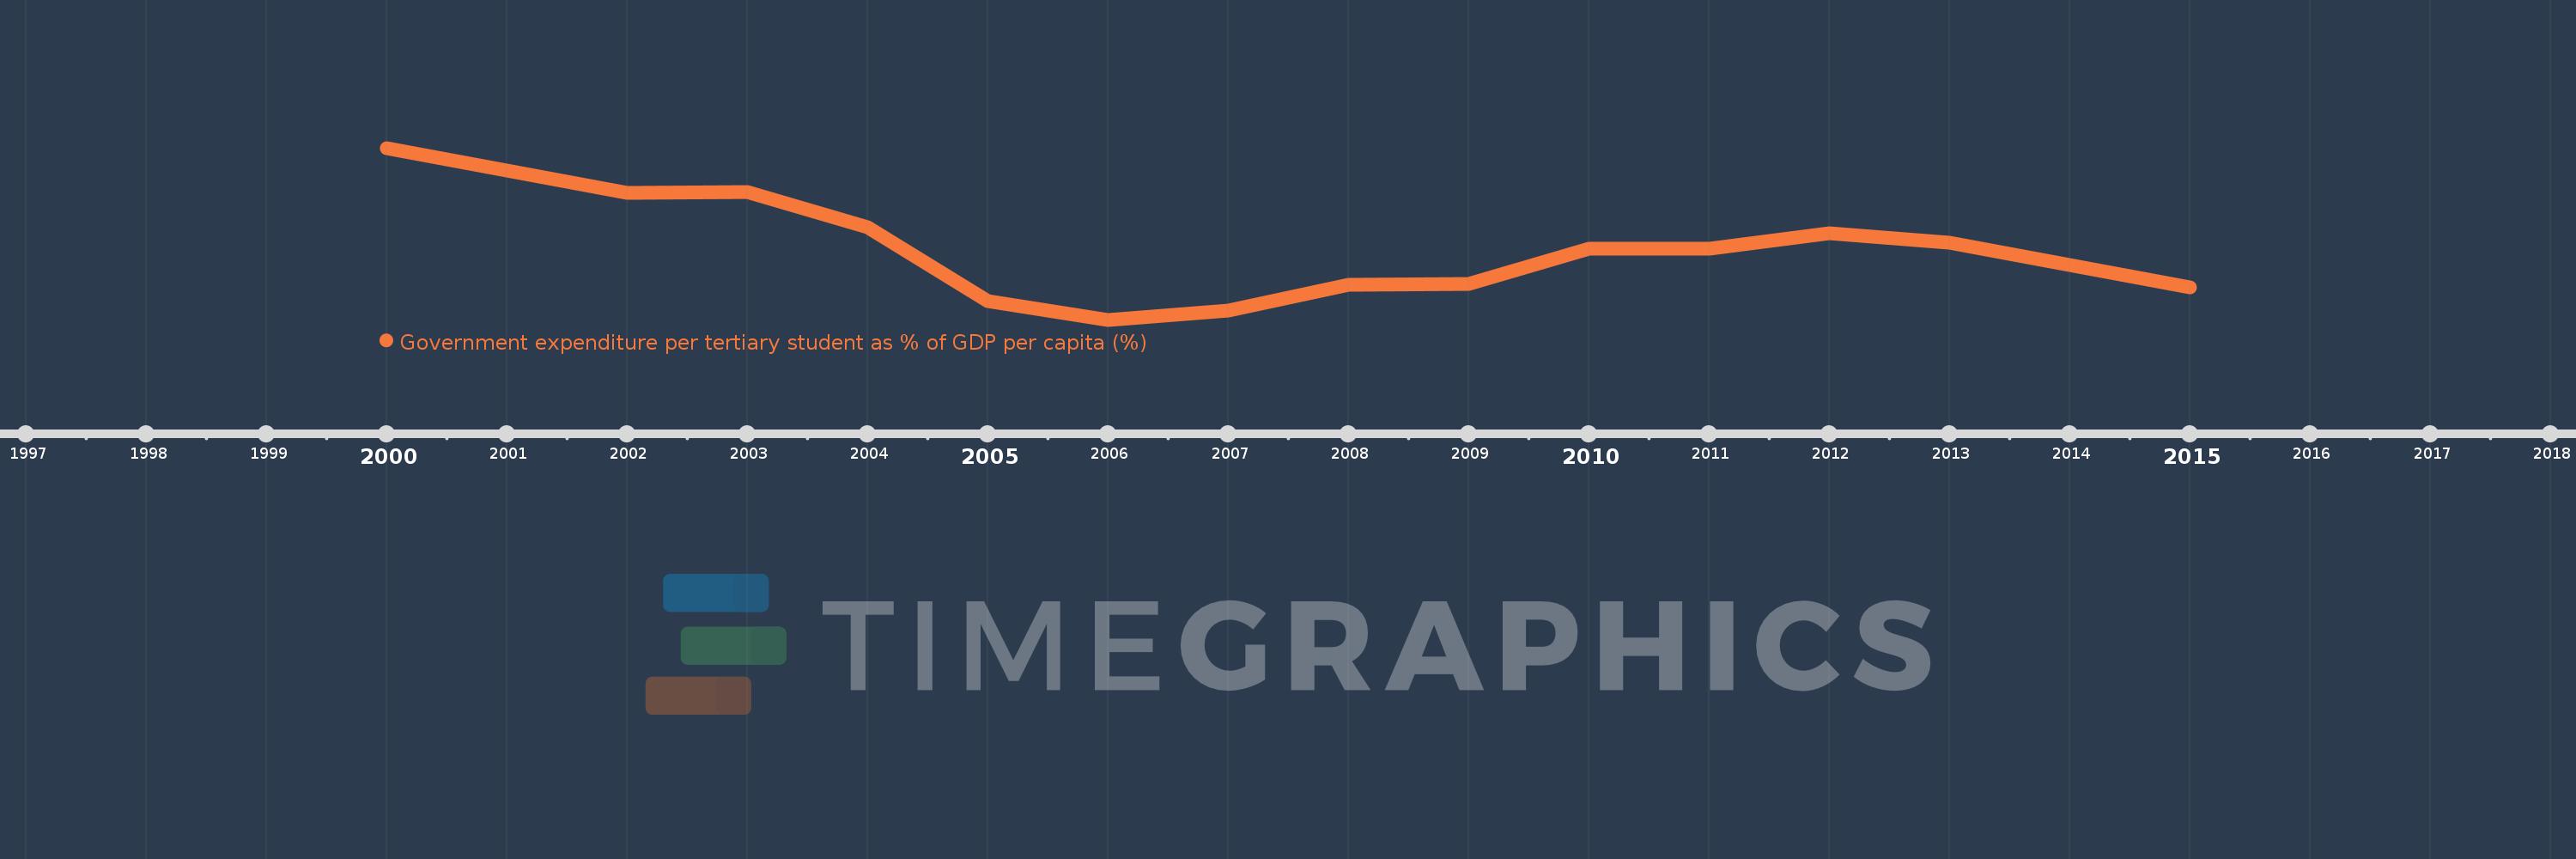
Cette échelle de temps montre un graphique de 2000 année à 2015 année New Zealand. Les données jusqu'à 1999 année ne sont pas présentés. Quantité d'observations actuelles selon dates: 14.

Source (désignation):

Les indicateurs du développement mondiale

Source (organisation):

UNESCO Institute for Statistics

Catégories:

Education

Dernière mise à jour

23 avr. 2017

Les indicateurs de changement de valeurs selon les années

En moyenne:
30.308
Minimum:
24.711
1 janv. 2006
Maximum:
38.795
1 janv. 2000
Pour la date d''observation
Valeur
Changement absolu
Le changement par rapport à la valeur précédente
1 janv. 2000
38.795
+38.795
0.0%
1 janv. 2002
35.145
-3.65
-9.41%
1 janv. 2003
35.209
+0.064
0.18%
1 janv. 2004
32.289
-2.92
-8.29%
1 janv. 2005
26.227
-6.062
-18.78%
1 janv. 2006
24.711
-1.516
-5.78%
1 janv. 2007
25.462
+0.751
3.04%
1 janv. 2008
27.574
+2.112
8.3%
1 janv. 2009
27.633
+0.059
0.21%
1 janv. 2010
30.548
+2.916
10.55%
1 janv. 2011
30.5
-0.048
-0.16%
1 janv. 2012
31.825
+1.325
4.34%
1 janv. 2013
31.024
-0.801
-2.52%
1 janv. 2015
27.373
-3.652
-11.77%

Classement des pays selon les statistiques actuelles par années