33
/fr/
AIzaSyB4mHJ5NPEv-XzF7P6NDYXjlkCWaeKw5bc
November 1, 2025
204715
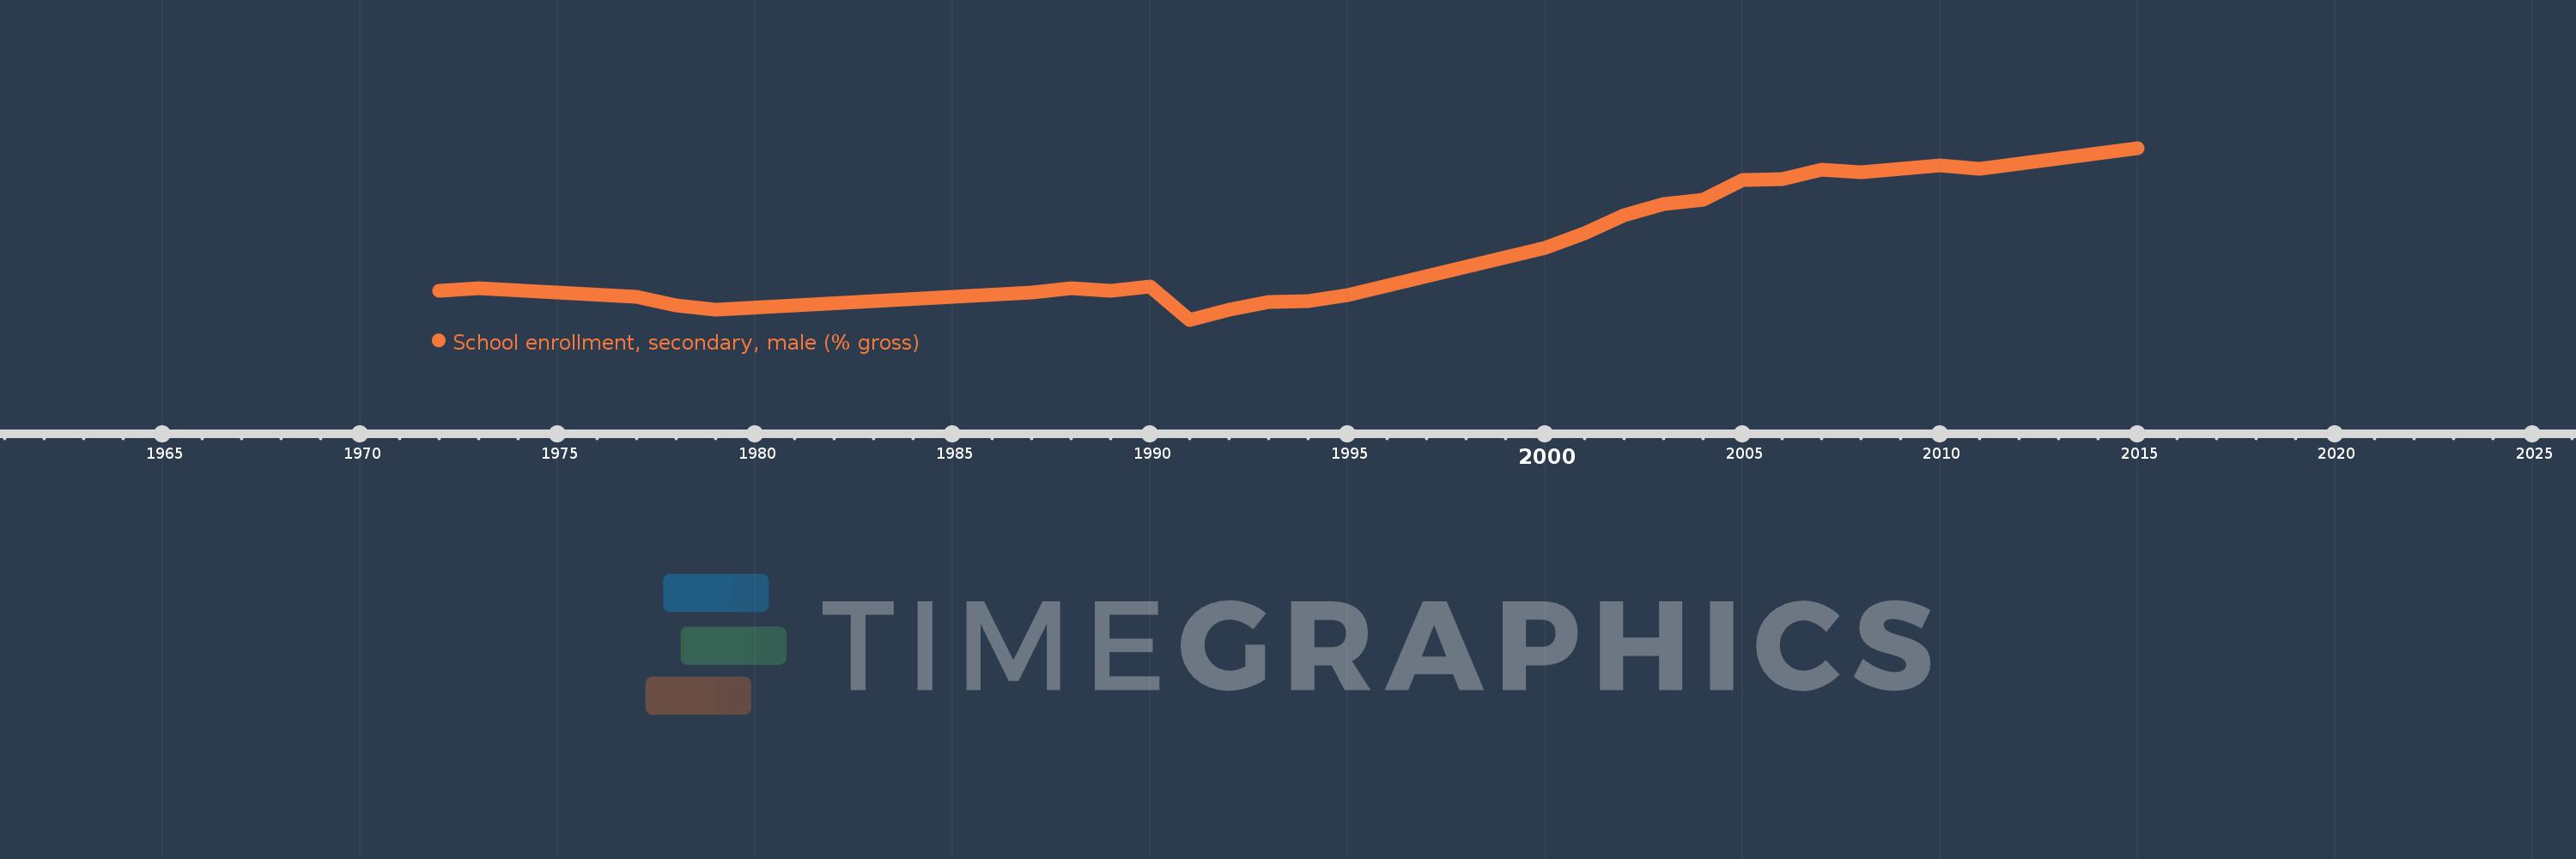
Myanmar
MMR
true
2
1
School enrollment, secondary, male (% gross)
2015,2011,2010,2008,2007,2006,2005,2004,2003,2002,2001,2000,1995,1994,1993,1992,1991,1990,1989,1988,1987,1979,1978,1977,1973,1972