33
/fr/
AIzaSyAYiBZKx7MnpbEhh9jyipgxe19OcubqV5w
May 1, 2025
201818
Morocco
MAR
true
2
1
Literacy rate, youth male (% of males ages 15-24)
2016,2012,2010,2009,2005,1995,1983
Download
Bibliothèque de statistiques globales →Morocco →

Literacy rate, youth male (% of males ages 15-24)

Cette statistique dans les autres pays:

AfghanistanAlbaniaAlgeriaAmerican SamoaAngolaArab WorldArgentinaArmeniaArubaAzerbaijanBahrainBangladeshBarbadosBelarusBelizeBeninBhutanBoliviaBosnia and HerzegovinaBotswanaBrazilBrunei DarussalamBulgariaBurkina FasoBurundiCabo VerdeCambodiaCameroonCaribbean small statesCayman IslandsCentral African RepublicCentral Europe and the BalticsChadChileChinaColombiaComorosCongo, Dem. Rep.Congo, Rep.Costa RicaCote d'IvoireCroatiaCubaCyprusDominican RepublicEarly-demographic dividendEast Asia & PacificEast Asia & Pacific (excluding high income)East Asia & Pacific (IDA & IBRD countries)EcuadorEgypt, Arab Rep.El SalvadorEquatorial GuineaEritreaEstoniaEthiopiaEurope & Central AsiaEurope & Central Asia (excluding high income)Europe & Central Asia (IDA & IBRD countries)Fragile and conflict affected situationsGabonGambia, TheGeorgiaGhanaGreeceGrenadaGuamGuatemalaGuineaGuinea-BissauGuyanaHaitiHeavily indebted poor countries (HIPC)HondurasHungaryIBRD onlyIDA & IBRD totalIDA blendIDA onlyIDA totalIndiaIndonesiaIran, Islamic Rep.IraqIsraelItalyJamaicaJordanKazakhstanKenyaKorea, Dem. People’s Rep.KuwaitKyrgyz RepublicLao PDRLate-demographic dividendLatin America & Caribbean Latin America & Caribbean (excluding high income)Latin America & the Caribbean (IDA & IBRD countries)LatviaLeast developed countries: UN classificationLebanonLesothoLiberiaLibyaLithuaniaLow & middle incomeLow incomeLower middle incomeMacao SAR, ChinaMacedonia, FYRMadagascarMalawiMalaysiaMaldivesMaliMaltaMarshall IslandsMauritaniaMauritiusMexicoMiddle East & North AfricaMiddle East & North Africa (excluding high income)Middle East & North Africa (IDA & IBRD countries)Middle incomeMoldovaMongoliaMontenegroMoroccoMozambiqueMyanmarNamibiaNepalNew CaledoniaNicaraguaNigerNigeriaOmanOther small statesPacific island small statesPakistanPalauPanamaPapua New GuineaParaguayPeruPhilippinesPolandPortugalPre-demographic dividendPuerto RicoQatarRomaniaRussian FederationRwandaSamoaSao Tome and PrincipeSaudi ArabiaSenegalSerbiaSeychellesSierra LeoneSingaporeSloveniaSmall statesSolomon IslandsSouth AfricaSouth AsiaSouth Asia (IDA & IBRD)South SudanSpainSri LankaSt. Vincent and the GrenadinesSub-Saharan Africa Sub-Saharan Africa (excluding high income)Sub-Saharan Africa (IDA & IBRD countries)SudanSurinameSwazilandSyrian Arab RepublicTajikistanTanzaniaThailandTimor-LesteTogoTongaTrinidad and TobagoTunisiaTurkeyTurkmenistanUgandaUkraineUnited Arab EmiratesUpper middle incomeUruguayUzbekistanVanuatuVenezuela, RBVietnamWest Bank and GazaWorldYemen, Rep.ZambiaZimbabwe

La ligne de temps

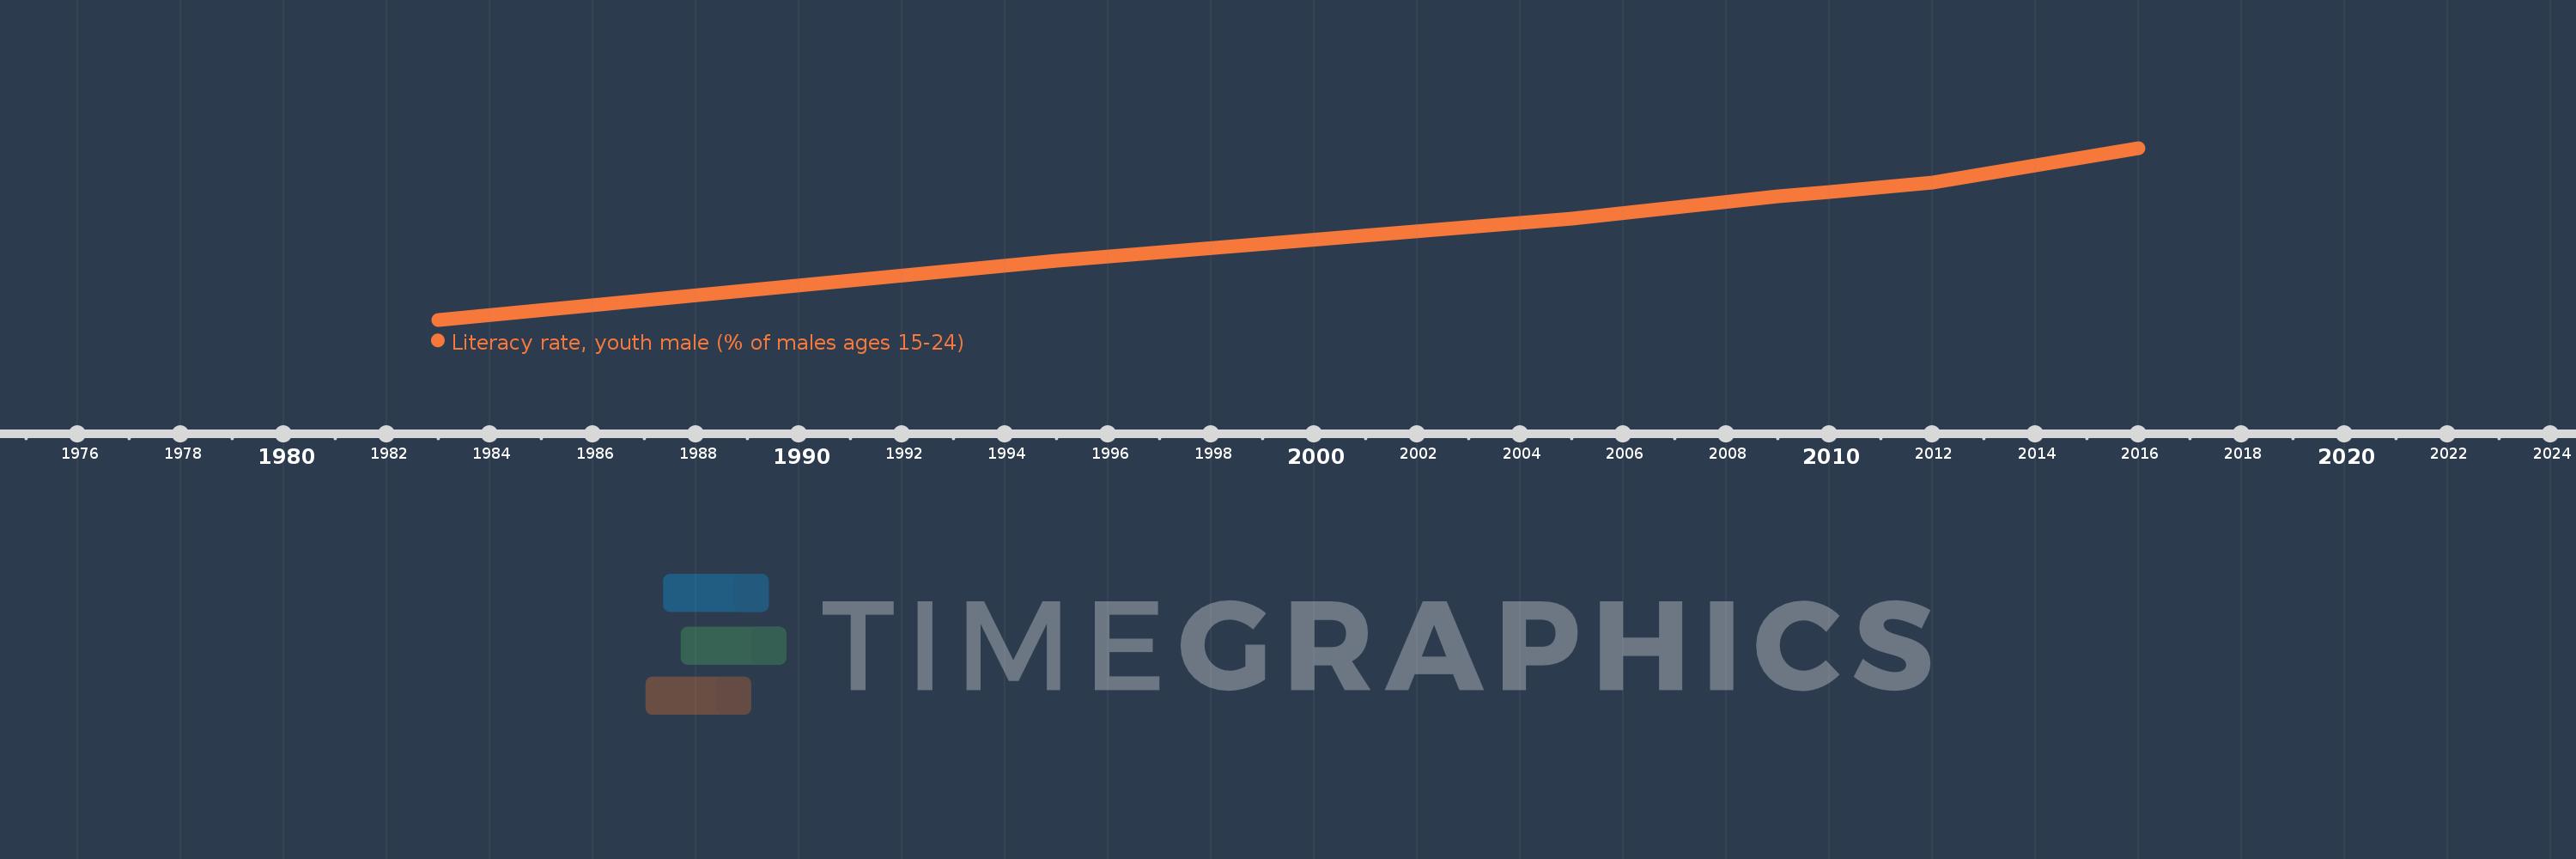
Cette échelle de temps montre un graphique de 1983 année à 2016 année Morocco. Les données jusqu'à 1982 année ne sont pas présentés. Quantité d'observations actuelles selon dates: 7.

Source (désignation):

Les indicateurs du développement mondiale

Source (organisation):

United Nations Educational, Scientific, and Cultural Organization (UNESCO) Institute for Statistics.

Catégories:

Education, Gender

Dernière mise à jour

23 avr. 2017

Les indicateurs de changement de valeurs selon les années

En moyenne:
81.181
Minimum:
58.117
1 janv. 1983
Maximum:
96.597
1 janv. 2016
Pour la date d''observation
Valeur
Changement absolu
Le changement par rapport à la valeur précédente
1 janv. 1983
58.117
+58.117
0.0%
1 janv. 1995
71.385
+13.268
22.83%
1 janv. 2005
80.803
+9.418
13.19%
1 janv. 2009
85.805
+5.003
6.19%
1 janv. 2010
86.729
+0.923
1.08%
1 janv. 2012
88.829
+2.101
2.42%
1 janv. 2016
96.597
+7.767
8.74%

Classement des pays selon les statistiques actuelles par années