33
/fr/
AIzaSyAYiBZKx7MnpbEhh9jyipgxe19OcubqV5w
August 1, 2025
198403
Moldova
MDA
true
2
1
Unemployment with secondary education (% of total unemployment)
2014,2013,2012,2011,2010,2009,2008,2007,2006,2005,2004,2003,2002,2001
Download
Bibliothèque de statistiques globales →Moldova →

Unemployment with secondary education (% of total unemployment)

Cette statistique dans les autres pays:

AlbaniaAlgeriaArgentinaArmeniaArubaAustraliaAustriaAzerbaijanBahamas, TheBahrainBangladeshBarbadosBelarusBelgiumBelizeBermudaBhutanBoliviaBosnia and HerzegovinaBotswanaBrazilBritish Virgin IslandsBrunei DarussalamBulgariaBurkina FasoCanadaCaribbean small statesCayman IslandsCentral African RepublicCentral Europe and the BalticsChadChileColombiaCosta RicaCroatiaCubaCyprusCzech RepublicDenmarkDominicaDominican RepublicEarly-demographic dividendEcuadorEgypt, Arab Rep.El SalvadorEstoniaEthiopiaEuro areaEurope & Central AsiaEurope & Central Asia (excluding high income)Europe & Central Asia (IDA & IBRD countries)European UnionFijiFinlandFranceFrench PolynesiaGabonGeorgiaGermanyGreeceGuatemalaHigh incomeHondurasHong Kong SAR, ChinaHungaryIcelandIndiaIndonesiaIran, Islamic Rep.IrelandIsraelItalyJamaicaJapanJordanKazakhstanKorea, Rep.KosovoKuwaitKyrgyz RepublicLatin America & Caribbean Latin America & Caribbean (excluding high income)Latin America & the Caribbean (IDA & IBRD countries)LatviaLebanonLesothoLithuaniaLower middle incomeLuxembourgMacao SAR, ChinaMacedonia, FYRMadagascarMalaysiaMaltaMauritiusMexicoMiddle East & North AfricaMiddle East & North Africa (excluding high income)Middle East & North Africa (IDA & IBRD countries)MoldovaMongoliaMontenegroMoroccoNamibiaNetherlandsNew CaledoniaNew ZealandNicaraguaNorth AmericaNorwayOECD membersOmanPakistanPanamaParaguayPeruPhilippinesPolandPortugalPost-demographic dividendQatarRomaniaRussian FederationRwandaSan MarinoSaudi ArabiaSenegalSerbiaSingaporeSlovak RepublicSloveniaSouth AfricaSouth AsiaSouth Asia (IDA & IBRD)SpainSri LankaSt. LuciaSt. Vincent and the GrenadinesSurinameSwedenSwitzerlandSyrian Arab RepublicTajikistanTanzaniaThailandTimor-LesteTongaTrinidad and TobagoTunisiaTurkeyUkraineUnited Arab EmiratesUnited KingdomUnited StatesUruguayVenezuela, RBWest Bank and GazaZimbabwe

La ligne de temps

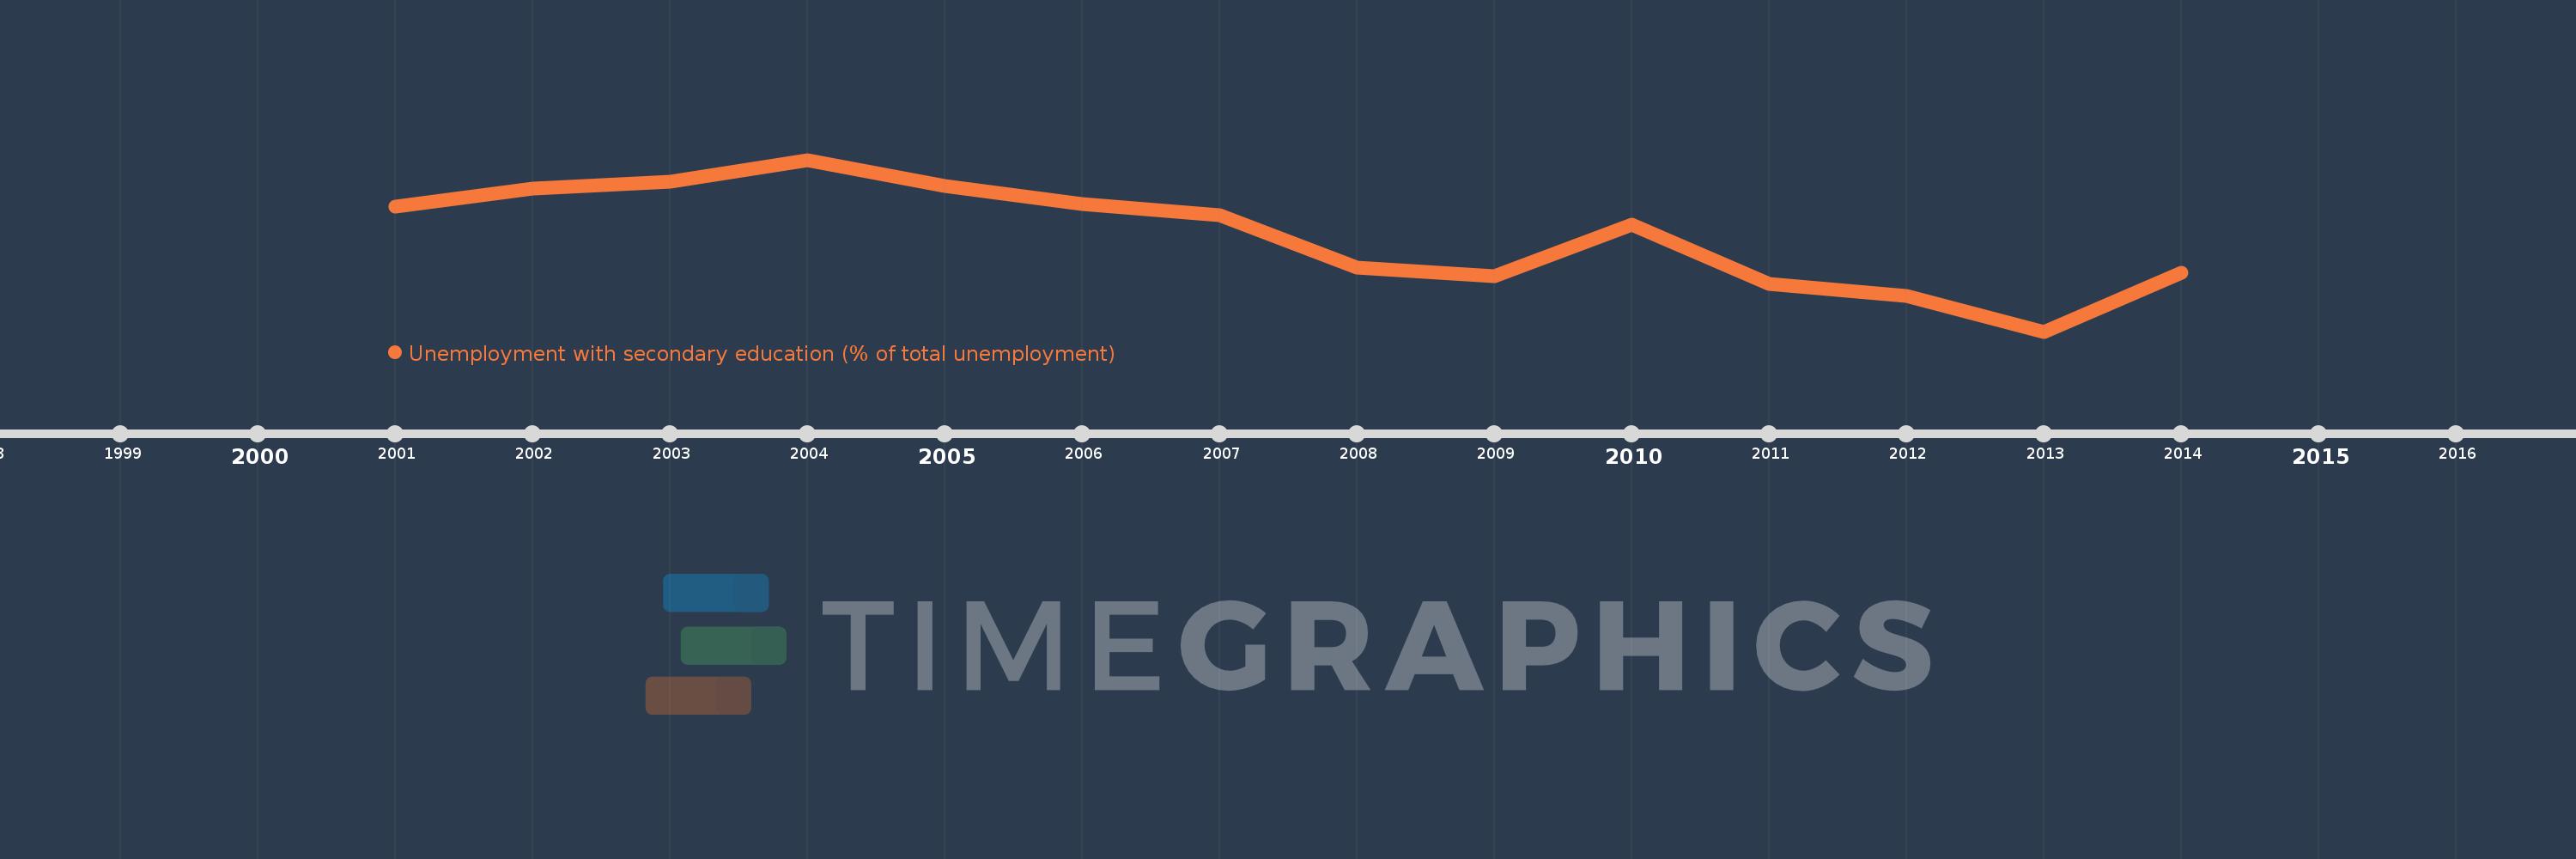
Cette échelle de temps montre un graphique de 2001 année à 2014 année Moldova. Les données jusqu'à 2000 année ne sont pas présentés. Quantité d'observations actuelles selon dates: 14.

Source (désignation):

Les indicateurs du développement mondiale

Source (organisation):

International Labour Organization, Key Indicators of the Labour Market database.

Catégories:

Social Protection & Labor

Dernière mise à jour

23 avr. 2017

Les indicateurs de changement de valeurs selon les années

En moyenne:
60.114
Minimum:
52.1
1 janv. 2013
Maximum:
66.4
1 janv. 2004
Pour la date d''observation
Valeur
Changement absolu
Le changement par rapport à la valeur précédente
1 janv. 2001
62.5
+62.5
0.0%
1 janv. 2002
64.0
+1.5
2.4%
1 janv. 2003
64.6
+0.6
0.94%
1 janv. 2004
66.4
+1.8
2.79%
1 janv. 2005
64.2
-2.2
-3.31%
1 janv. 2006
62.7
-1.5
-2.34%
1 janv. 2007
61.8
-0.9
-1.44%
1 janv. 2008
57.4
-4.4
-7.12%
1 janv. 2009
56.7
-0.7
-1.22%
1 janv. 2010
61.0
+4.3
7.58%
1 janv. 2011
56.1
-4.9
-8.03%
1 janv. 2012
55.1
-1.0
-1.78%
1 janv. 2013
52.1
-3.0
-5.44%
1 janv. 2014
57.0
+4.9
9.4%

Classement des pays selon les statistiques actuelles par années