29
/fr/
fr
AIzaSyAYiBZKx7MnpbEhh9jyipgxe19OcubqV5w
April 1, 2024
189064
Maldives
MDV
true
2
1
Gross fixed capital formation (current US$)
2006,2005,2004,2003,2002,2001,2000,1999,1998,1997,1996,1991,1990,1989,1988,1987,1986,1985,1984,1983,1982,1981
Download
Bibliothèque de statistiques globales →Maldives →

Gross fixed capital formation (current US$)

Cette statistique dans les autres pays:
AfghanistanAlbaniaAlgeriaAngolaAntigua and BarbudaArab WorldArgentinaArmeniaArubaAustraliaAustriaAzerbaijanBahamas, TheBahrainBangladeshBarbadosBelarusBelgiumBelizeBeninBermudaBhutanBoliviaBosnia and HerzegovinaBotswanaBrazilBrunei DarussalamBulgariaBurkina FasoBurundiCabo VerdeCambodiaCameroonCanadaCaribbean small statesCentral African RepublicCentral Europe and the BalticsChadChileChinaColombiaComorosCongo, Dem. Rep.Congo, Rep.Costa RicaCote d'IvoireCroatiaCubaCyprusCzech RepublicDenmarkDjiboutiDominicaDominican RepublicEarly-demographic dividendEast Asia & PacificEast Asia & Pacific (excluding high income)East Asia & Pacific (IDA & IBRD countries)EcuadorEgypt, Arab Rep.El SalvadorEquatorial GuineaEritreaEstoniaEthiopiaEuro areaEurope & Central AsiaEurope & Central Asia (excluding high income)Europe & Central Asia (IDA & IBRD countries)European UnionFijiFinlandFragile and conflict affected situationsFranceGabonGambia, TheGeorgiaGermanyGhanaGreeceGrenadaGuatemalaGuineaGuinea-BissauGuyanaHaitiHeavily indebted poor countries (HIPC)High incomeHondurasHong Kong SAR, ChinaHungaryIBRD onlyIcelandIDA & IBRD totalIDA blendIDA onlyIDA totalIndiaIndonesiaIran, Islamic Rep.IraqIrelandIsraelItalyJamaicaJapanJordanKazakhstanKenyaKiribatiKorea, Rep.KosovoKuwaitKyrgyz RepublicLao PDRLate-demographic dividendLatin America & Caribbean Latin America & Caribbean (excluding high income)Latin America & the Caribbean (IDA & IBRD countries)LatviaLeast developed countries: UN classificationLebanonLesothoLiberiaLibyaLithuaniaLow & middle incomeLow incomeLower middle incomeLuxembourgMacao SAR, ChinaMacedonia, FYRMadagascarMalawiMalaysiaMaldivesMaliMaltaMauritaniaMauritiusMexicoMicronesia, Fed. Sts.Middle East & North AfricaMiddle East & North Africa (excluding high income)Middle East & North Africa (IDA & IBRD countries)Middle incomeMoldovaMongoliaMontenegroMoroccoMozambiqueNamibiaNepalNetherlandsNew CaledoniaNew ZealandNicaraguaNigerNigeriaNorth AmericaNorwayOECD membersOmanPakistanPanamaPapua New GuineaParaguayPeruPhilippinesPolandPortugalPost-demographic dividendPre-demographic dividendPuerto RicoRomaniaRussian FederationRwandaSaudi ArabiaSenegalSerbiaSeychellesSierra LeoneSingaporeSlovak RepublicSloveniaSolomon IslandsSomaliaSouth AfricaSouth AsiaSouth Asia (IDA & IBRD)South SudanSpainSri LankaSt. Kitts and NevisSt. LuciaSt. Vincent and the GrenadinesSub-Saharan Africa Sub-Saharan Africa (excluding high income)Sub-Saharan Africa (IDA & IBRD countries)SudanSurinameSwazilandSwedenSwitzerlandSyrian Arab RepublicTajikistanTanzaniaThailandTimor-LesteTogoTongaTrinidad and TobagoTunisiaTurkeyTurkmenistanUgandaUkraineUnited Arab EmiratesUnited KingdomUnited StatesUpper middle incomeUruguayUzbekistanVanuatuVenezuela, RBVietnamWest Bank and GazaWorldYemen, Rep.ZambiaZimbabwe
La ligne de temps
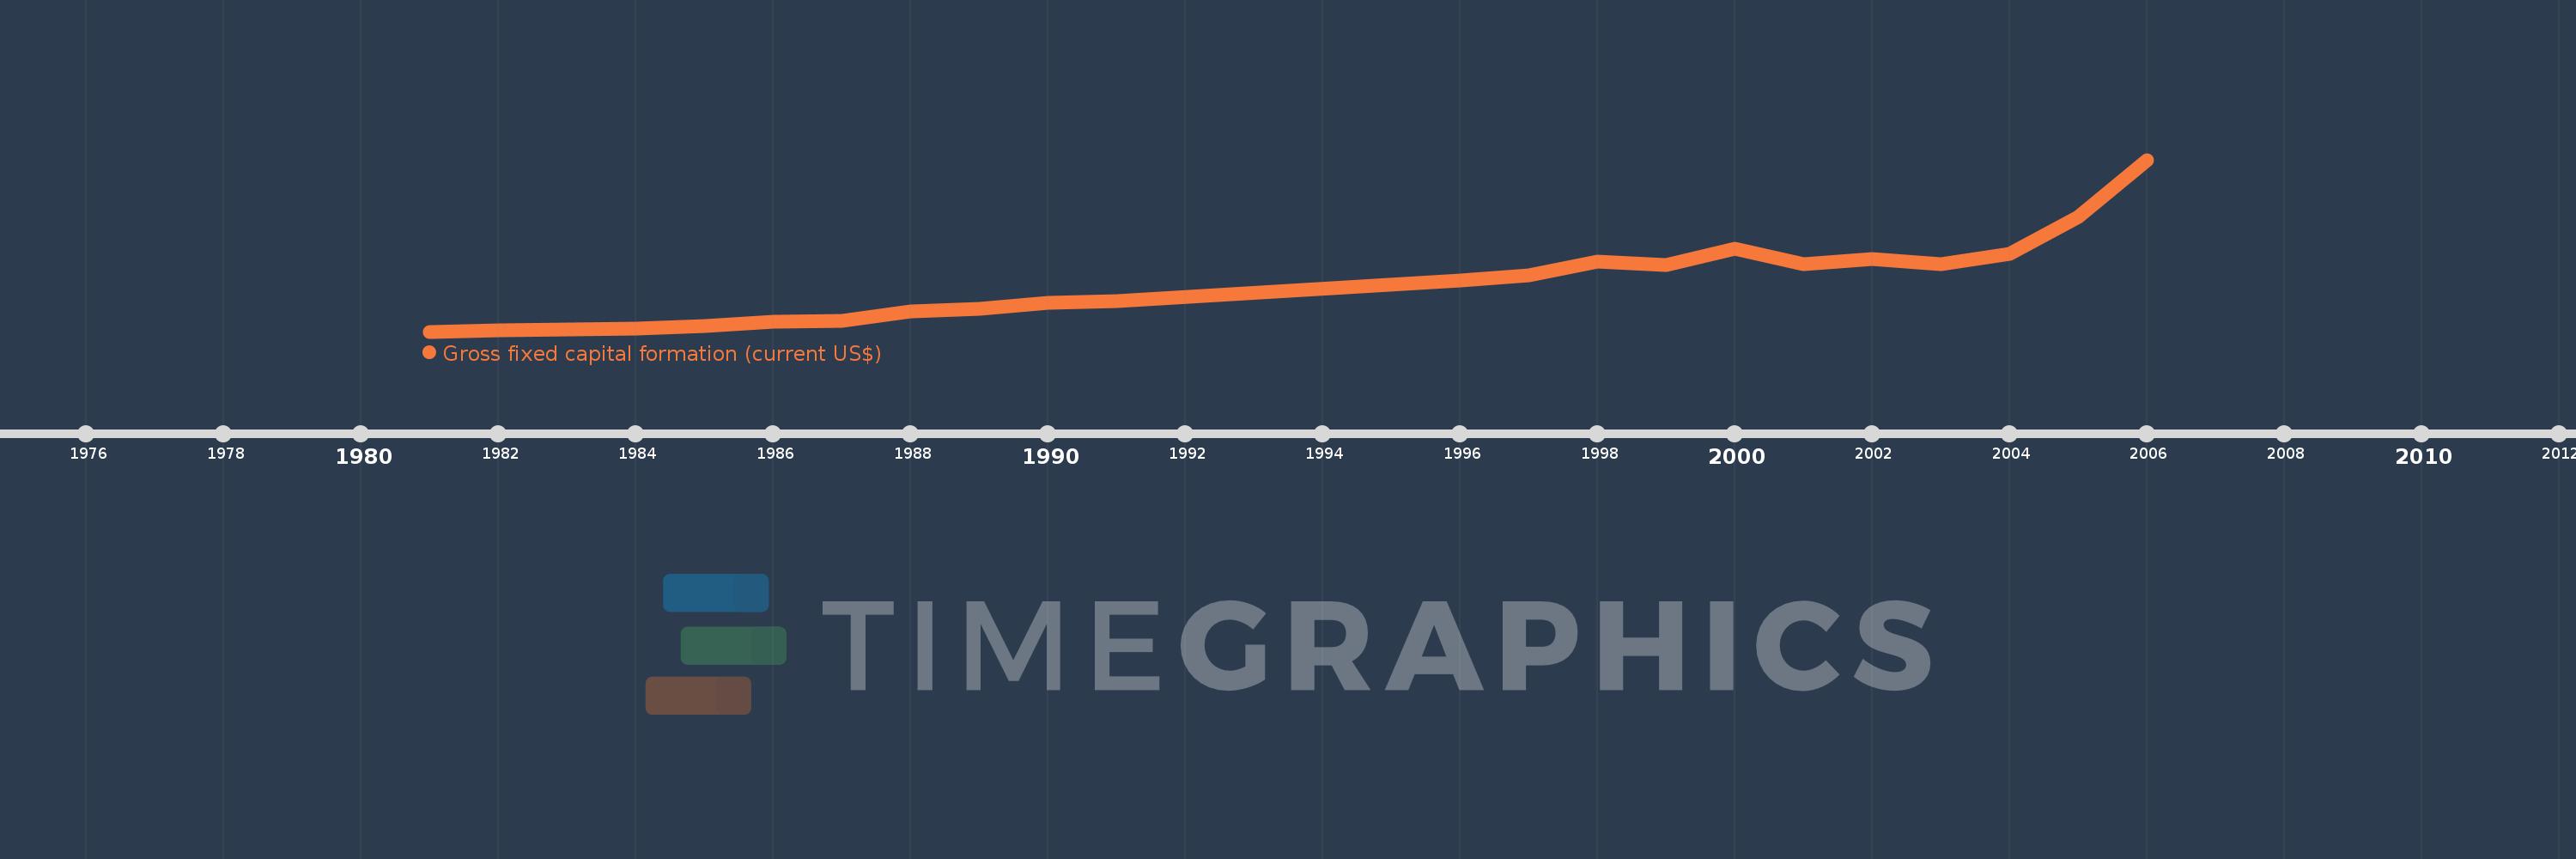
Cette échelle de temps montre un graphique de 1981 année à 2006 année Maldives. Les données jusqu'à 1980 année ne sont pas présentés. Quantité d'observations actuelles selon dates: 22.
Source (désignation):
Les indicateurs du développement mondiale
Source (organisation):
World Bank national accounts data, and OECD National Accounts data files.
Catégories:
Economy & Growth
Dernière mise à jour
23 avr. 2017
Les indicateurs de changement de valeurs selon les années
En moyenne:
117.021 mln.
Minimum:
10.066 mln.
1 janv. 1981
Maximum:
401.086 mln.
1 janv. 2006
Pour la date d''observation
Valeur
Changement absolu
Le changement par rapport à la valeur précédente
1 janv. 1981
10.066 mln.
+10.066 mln.
0.0%
1 janv. 1982
13.046 mln.
+2.98 mln.
29.61%
1 janv. 1983
14.714 mln.
+1.668 mln.
12.78%
1 janv. 1984
16.34 mln.
+1.626 mln.
11.05%
1 janv. 1985
23.404 mln.
+7.064 mln.
43.23%
1 janv. 1986
32.901 mln.
+9.497 mln.
40.58%
1 janv. 1987
35.315 mln.
+2.413 mln.
7.33%
1 janv. 1988
55.39 mln.
+20.076 mln.
56.85%
1 janv. 1989
61.993 mln.
+6.603 mln.
11.92%
1 janv. 1990
75.73 mln.
+13.737 mln.
22.16%
1 janv. 1991
79.037 mln.
+3.307 mln.
4.37%
1 janv. 1996
125.658 mln.
+46.622 mln.
58.99%
1 janv. 1997
137.536 mln.
+11.878 mln.
9.45%
1 janv. 1998
168.561 mln.
+31.025 mln.
22.56%
1 janv. 1999
162.32 mln.
-6.241 mln.
-3.7%
1 janv. 2000
198.218 mln.
+35.898 mln.
22.12%
1 janv. 2001
164.344 mln.
-33.874 mln.
-17.09%
1 janv. 2002
175.464 mln.
+11.119 mln.
6.77%
1 janv. 2003
163.545 mln.
-11.919 mln.
-6.79%
1 janv. 2004
187.958 mln.
+24.413 mln.
14.93%
1 janv. 2005
271.832 mln.
+83.874 mln.
44.62%
1 janv. 2006
401.086 mln.
+129.254 mln.
47.55%
Classement des pays selon les statistiques actuelles par années

Commentaires:

Envoyer
PremiumAbout & FeedbackUn accordConfidentialité
logo
© 2022 Selected Technologies LLC – Morgan Hill, California