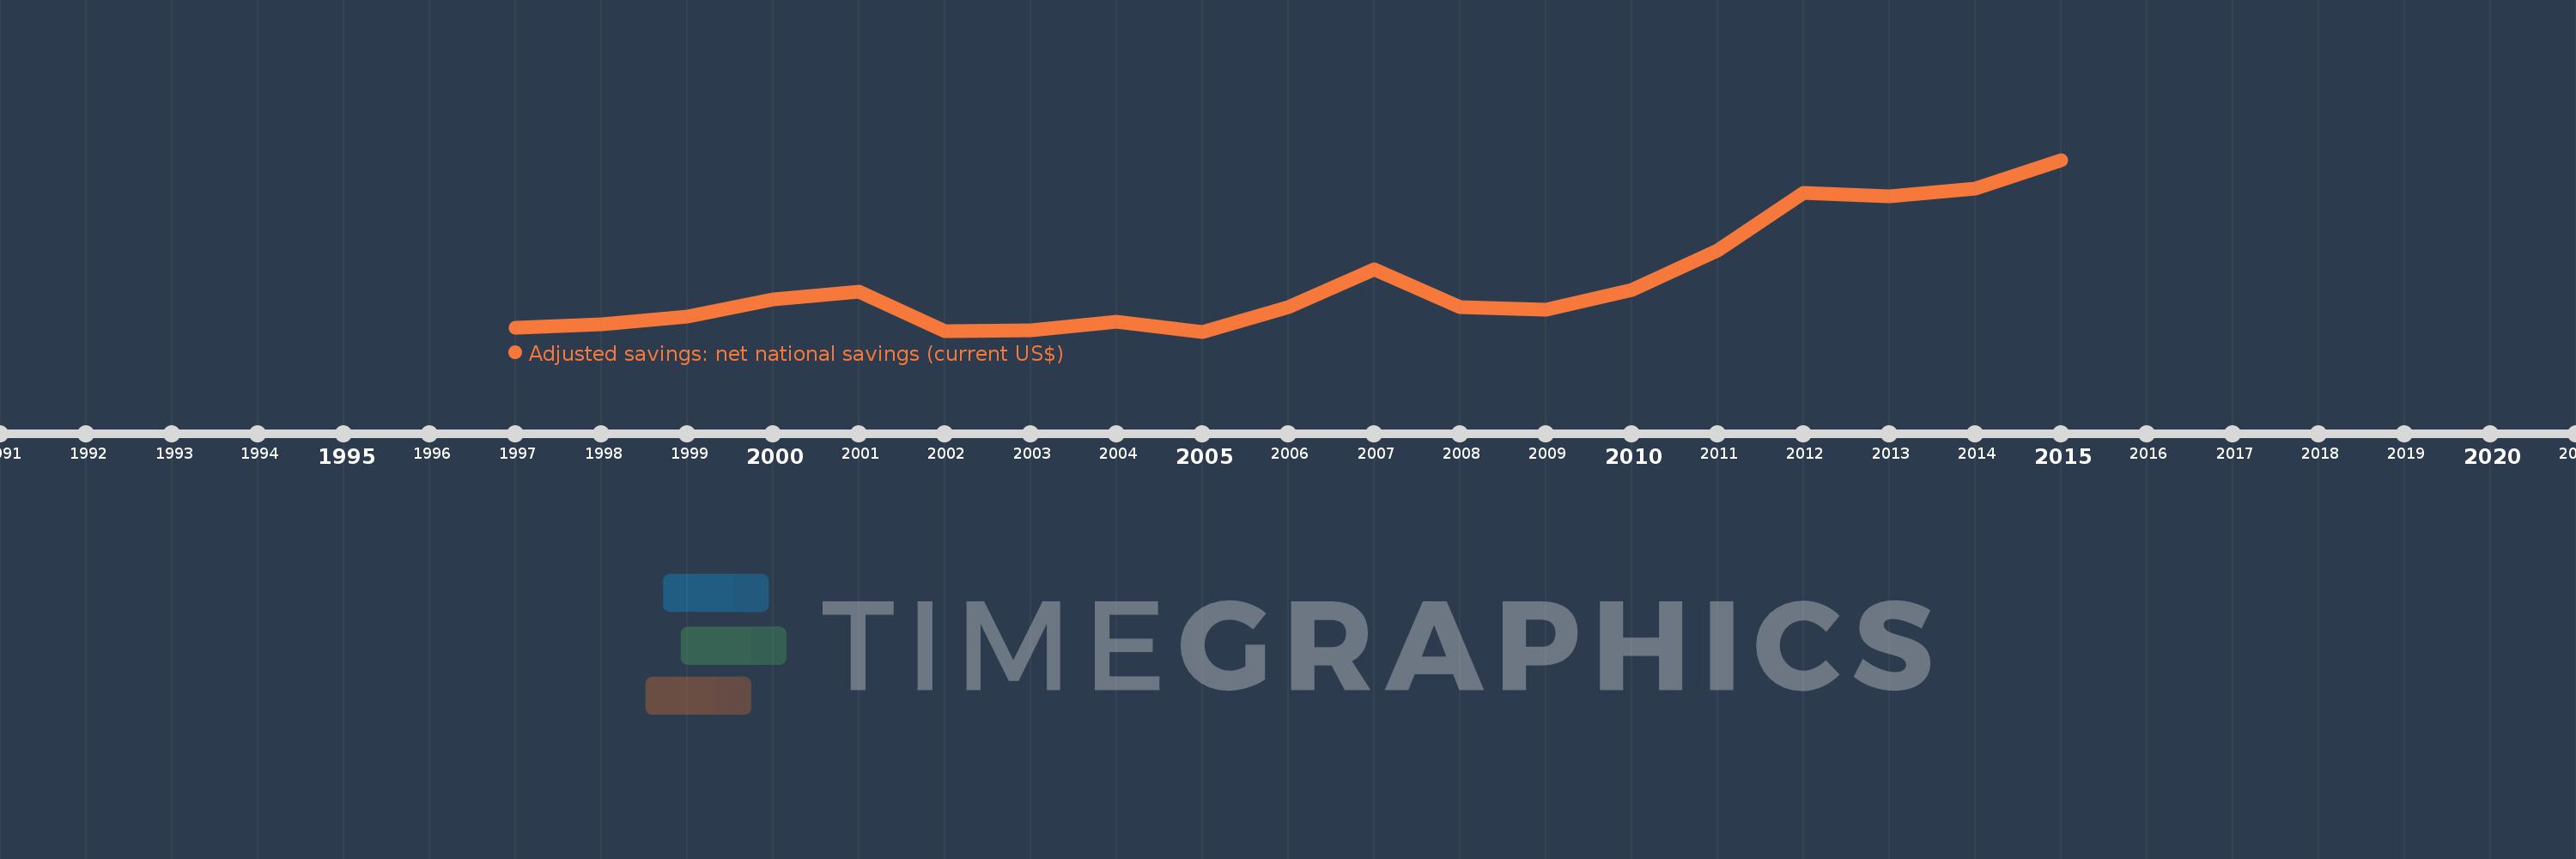
Cette échelle de temps montre un graphique de 1997 année à 2015 année Macedonia, FYR. Les données jusqu'à 1996 année ne sont pas présentés. Quantité d'observations actuelles selon dates: 19.
Source (désignation):
Les indicateurs du développement mondiale
Source (organisation):
World Bank staff estimates based on sources and methods in World Bank's "The Changing Wealth of Nations: Measuring Sustainable Development in the New Millennium" (2011).
Catégories:
Economy & Growth, Environment
Dernière mise à jour
23 avr. 2017
Les indicateurs de changement de valeurs selon les années
En moyenne:
310.786 mln.
Minimum:
-182.577 mln.
1 janv. 2005
Maximum:
1.505 mds
1 janv. 2015
Pour la date d''observation
Valeur
Changement absolu
Le changement par rapport à la valeur précédente
1 janv. 1997
-142.921 mln.
-142.921 mln.
0.0%
1 janv. 1998
-113.638 mln.
+29.283 mln.
-20.49%
1 janv. 1999
-38.164 mln.
+75.474 mln.
-66.42%
1 janv. 2000
136.492 mln.
+174.656 mln.
-457.64%
1 janv. 2001
210.412 mln.
+73.92 mln.
54.16%
1 janv. 2002
-177.723 mln.
-388.136 mln.
-184.46%
1 janv. 2003
-173.027 mln.
+4.696 mln.
-2.64%
1 janv. 2004
-86.908 mln.
+86.119 mln.
-49.77%
1 janv. 2005
-182.577 mln.
-95.669 mln.
110.08%
1 janv. 2006
59.39 mln.
+241.967 mln.
-132.53%
1 janv. 2007
431.363 mln.
+371.974 mln.
626.32%
1 janv. 2008
54.29 mln.
-377.074 mln.
-87.41%
1 janv. 2009
30.703 mln.
-23.586 mln.
-43.45%
1 janv. 2010
230.008 mln.
+199.305 mln.
649.14%
1 janv. 2011
618.442 mln.
+388.434 mln.
168.88%
1 janv. 2012
1.178 mds
+559.2 mln.
90.42%
1 janv. 2013
1.147 mds
-30.177 mln.
-2.56%
1 janv. 2014
1.219 mds
+71.222 mln.
6.21%
1 janv. 2015
1.505 mds
+286.314 mln.
23.49%
Classement des pays selon les statistiques actuelles par années