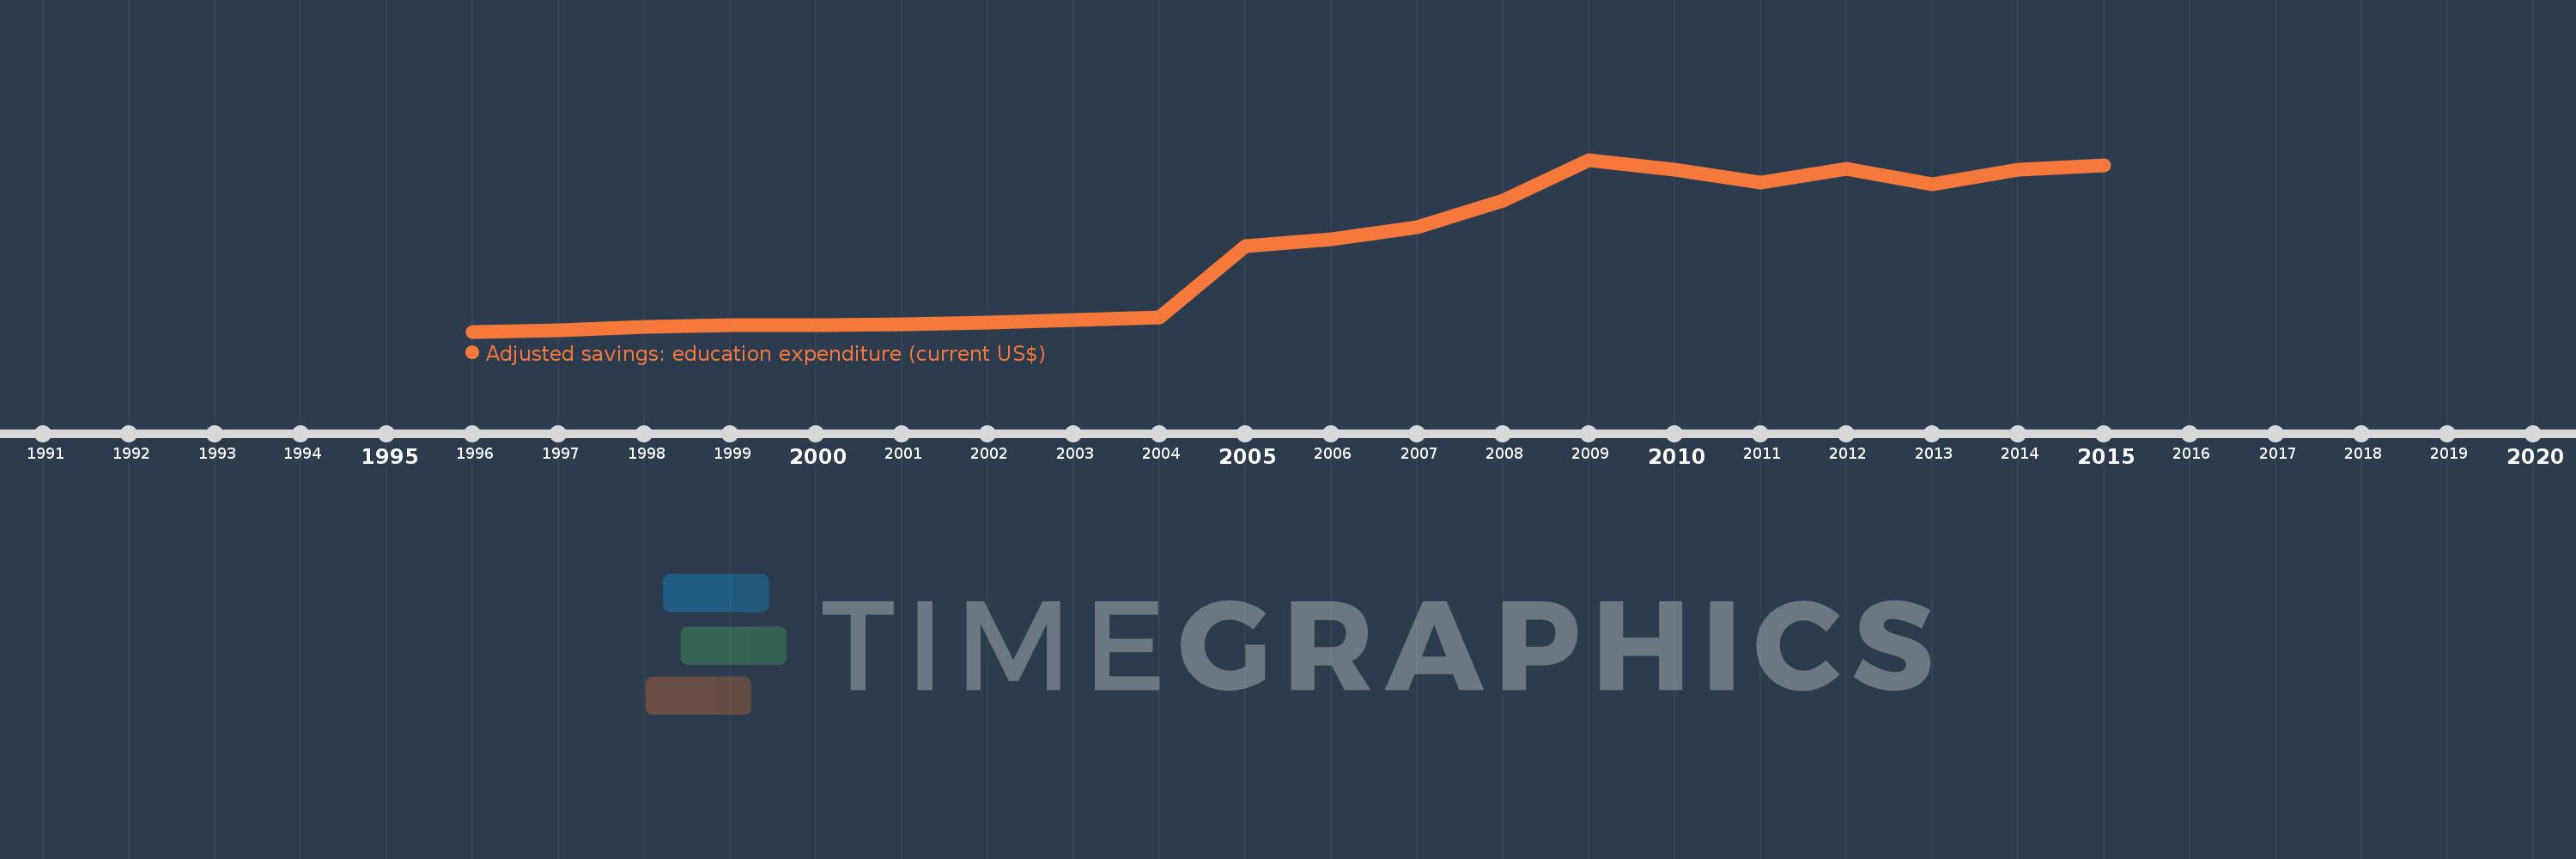
Cette échelle de temps montre un graphique de 1996 année à 2015 année Lithuania. Les données jusqu'à 1995 année ne sont pas présentés. Quantité d'observations actuelles selon dates: 20.
Source (désignation):
Les indicateurs du développement mondiale
Source (organisation):
World Bank staff estimates using data from the United Nations Statistics Division's Statistical Yearbook, and the UNESCO Institute for Statistics online database.
Catégories:
Economy & Growth, Environment
Dernière mise à jour
23 avr. 2017
Les indicateurs de changement de valeurs selon les années
En moyenne:
3.61 mds
Minimum:
345.739 mln.
1 janv. 1996
Maximum:
7.38 mds
1 janv. 2009
Pour la date d''observation
Valeur
Changement absolu
Le changement par rapport à la valeur précédente
1 janv. 1996
345.739 mln.
+345.739 mln.
0.0%
1 janv. 1997
382.101 mln.
+36.362 mln.
10.52%
1 janv. 1998
527.299 mln.
+145.198 mln.
38.0%
1 janv. 1999
607.326 mln.
+80.027 mln.
15.18%
1 janv. 2000
602.823 mln.
-4.503 mln.
-0.74%
1 janv. 2001
648.624 mln.
+45.801 mln.
7.6%
1 janv. 2002
701.647 mln.
+53.023 mln.
8.17%
1 janv. 2003
804.57 mln.
+102.923 mln.
14.67%
1 janv. 2004
926.954 mln.
+122.384 mln.
15.21%
1 janv. 2005
3.857 mds
+2.93 mds
316.09%
1 janv. 2006
4.143 mds
+285.886 mln.
7.41%
1 janv. 2007
4.637 mds
+493.827 mln.
11.92%
1 janv. 2008
5.699 mds
+1.062 mds
22.91%
1 janv. 2009
7.38 mds
+1.681 mds
29.5%
1 janv. 2010
6.988 mds
-392.15 mln.
-5.31%
1 janv. 2011
6.442 mds
-546.543 mln.
-7.82%
1 janv. 2012
7.008 mds
+566.791 mln.
8.8%
1 janv. 2013
6.376 mds
-632.364 mln.
-9.02%
1 janv. 2014
6.965 mds
+588.521 mln.
9.23%
1 janv. 2015
7.154 mds
+189.389 mln.
2.72%
Classement des pays selon les statistiques actuelles par années