29
/fr/
fr
AIzaSyAYiBZKx7MnpbEhh9jyipgxe19OcubqV5w
April 1, 2024
177758
Lesotho
LSO
true
2
1
Household final consumption expenditure (current LCU)
1982,1981,1980,1979,1978,1977,1976,1975,1974,1973,1972,1971,1970,1969,1968,1967,1966,1965,1964,1963,1962,1961
Download
Bibliothèque de statistiques globales →Lesotho →

Household final consumption expenditure (current LCU)

Cette statistique dans les autres pays:
AfghanistanAlbaniaAlgeriaAngolaAntigua and BarbudaArgentinaArmeniaArubaAustraliaAustriaAzerbaijanBahamas, TheBahrainBangladeshBarbadosBelarusBelgiumBelizeBeninBermudaBhutanBoliviaBosnia and HerzegovinaBotswanaBrazilBrunei DarussalamBulgariaBurkina FasoBurundiCabo VerdeCambodiaCameroonCanadaCentral African RepublicChadChileChinaColombiaComorosCongo, Dem. Rep.Congo, Rep.Costa RicaCote d'IvoireCroatiaCubaCyprusCzech RepublicDenmarkDjiboutiDominicaDominican RepublicEcuadorEgypt, Arab Rep.El SalvadorEquatorial GuineaEritreaEstoniaEthiopiaFaroe IslandsFijiFinlandFranceGabonGambia, TheGeorgiaGermanyGhanaGreeceGrenadaGuatemalaGuineaGuinea-BissauGuyanaHaitiHondurasHong Kong SAR, ChinaHungaryIcelandIndiaIndonesiaIran, Islamic Rep.IrelandIsraelItalyJamaicaJapanJordanKazakhstanKenyaKiribatiKorea, Rep.KosovoKuwaitKyrgyz RepublicLao PDRLatviaLebanonLesothoLiberiaLibyaLithuaniaLuxembourgMacao SAR, ChinaMacedonia, FYRMadagascarMalawiMalaysiaMaliMaltaMauritaniaMauritiusMexicoMicronesia, Fed. Sts.MoldovaMongoliaMontenegroMoroccoMozambiqueNamibiaNepalNetherlandsNew CaledoniaNew ZealandNicaraguaNigerNigeriaNorwayOmanPakistanPanamaPapua New GuineaParaguayPeruPhilippinesPolandPortugalPuerto RicoQatarRomaniaRussian FederationRwandaSaudi ArabiaSenegalSerbiaSeychellesSierra LeoneSingaporeSlovak RepublicSloveniaSolomon IslandsSomaliaSouth AfricaSouth SudanSpainSri LankaSt. Kitts and NevisSt. LuciaSt. Vincent and the GrenadinesSudanSurinameSwazilandSwedenSwitzerlandSyrian Arab RepublicTajikistanTanzaniaThailandTimor-LesteTogoTongaTrinidad and TobagoTunisiaTurkeyTurkmenistanUgandaUkraineUnited Arab EmiratesUnited KingdomUnited StatesUruguayUzbekistanVanuatuVenezuela, RBVietnamWest Bank and GazaYemen, Rep.ZambiaZimbabwe
La ligne de temps
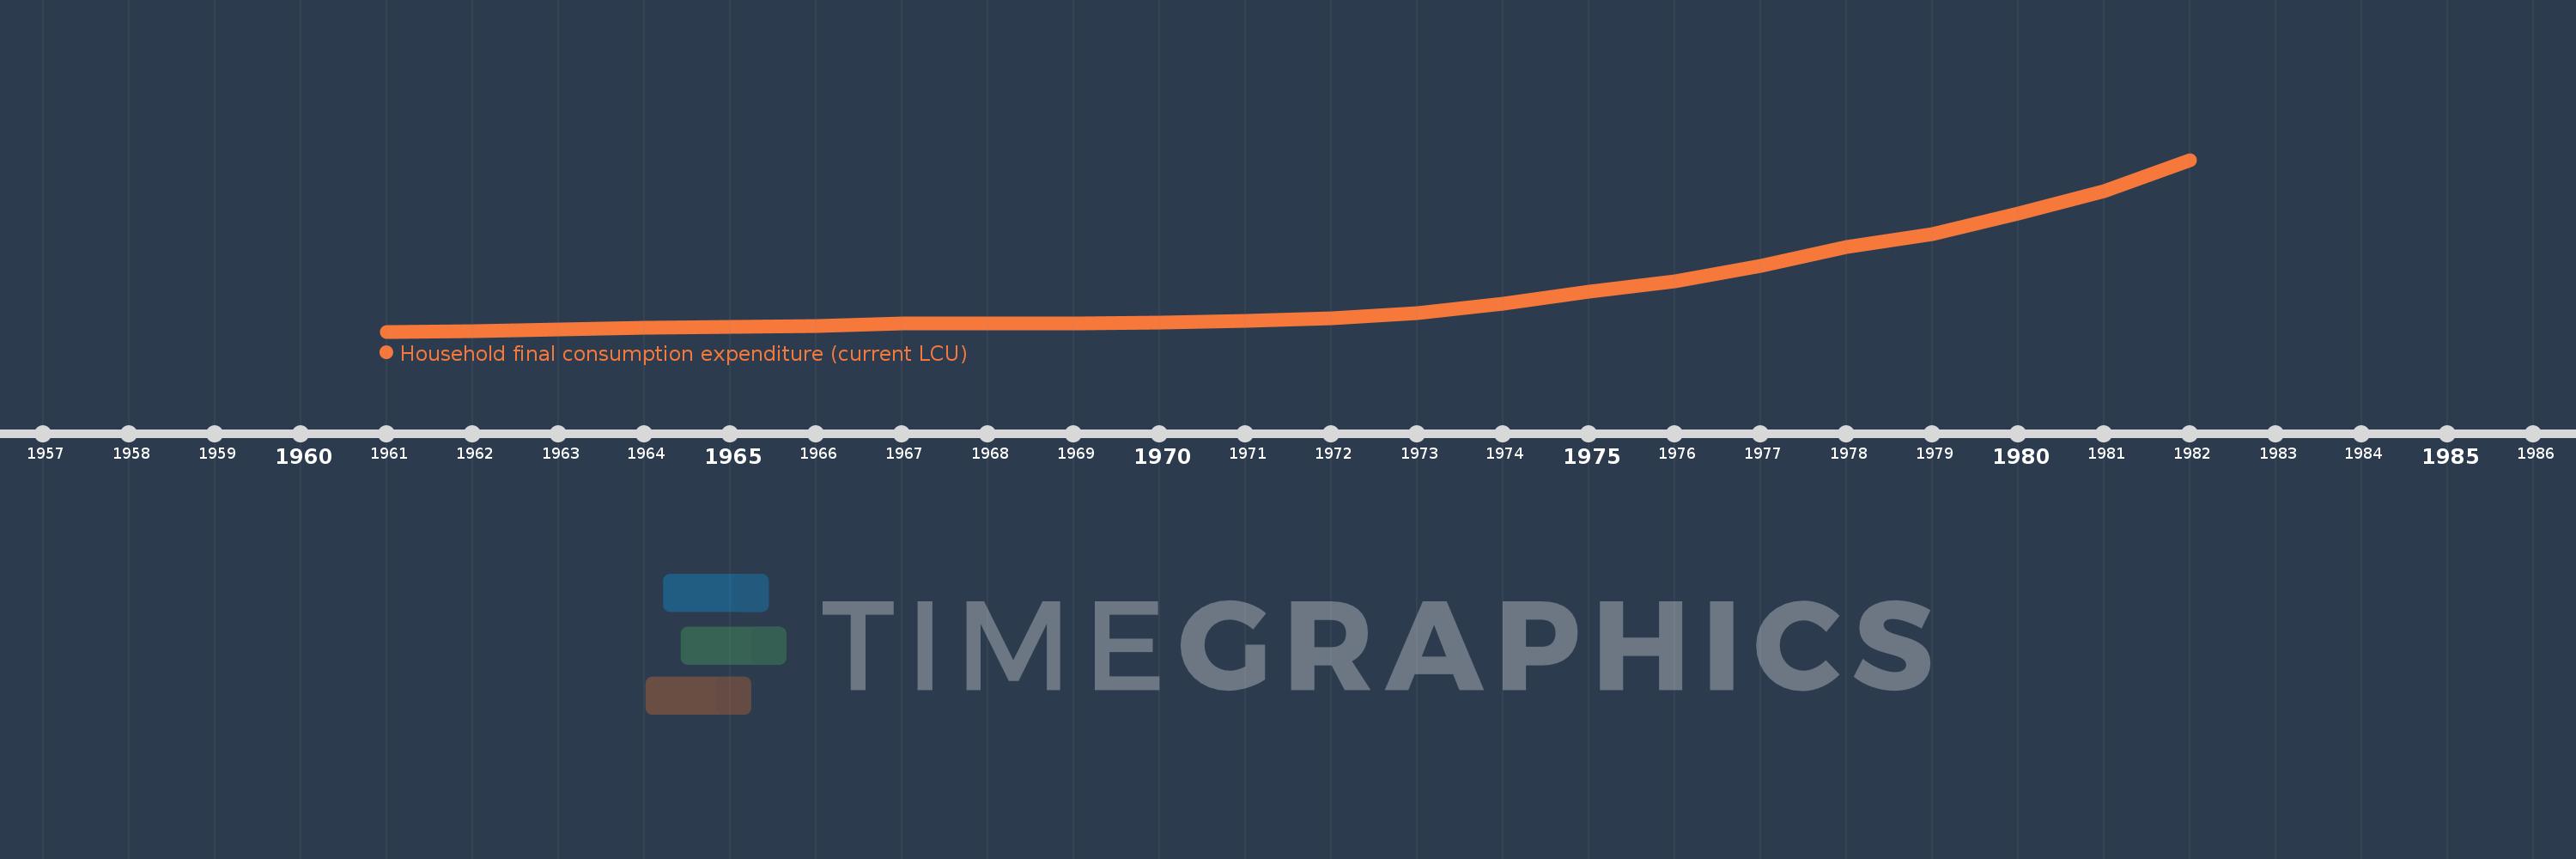
Cette échelle de temps montre un graphique de 1961 année à 1982 année Lesotho. Les données jusqu'à 1960 année ne sont pas présentés. Quantité d'observations actuelles selon dates: 22.
Source (désignation):
Les indicateurs du développement mondiale
Source (organisation):
World Bank national accounts data, and OECD National Accounts data files.
Catégories:
Economy & Growth
Dernière mise à jour
23 avr. 2017
Les indicateurs de changement de valeurs selon les années
En moyenne:
145.019 mln.
Minimum:
26.7 mln.
1 janv. 1961
Maximum:
530.418 mln.
1 janv. 1982
Pour la date d''observation
Valeur
Changement absolu
Le changement par rapport à la valeur précédente
1 janv. 1961
26.7 mln.
+26.7 mln.
0.0%
1 janv. 1962
27.5 mln.
+800.0 milles
3.0%
1 janv. 1963
32.1 mln.
+4.6 mln.
16.73%
1 janv. 1964
37.1 mln.
+5.0 mln.
15.58%
1 janv. 1965
40.5 mln.
+3.4 mln.
9.16%
1 janv. 1966
42.6 mln.
+2.1 mln.
5.19%
1 janv. 1967
49.8 mln.
+7.2 mln.
16.9%
1 janv. 1968
49.53 mln.
-270.0 milles
-0.54%
1 janv. 1969
51.19 mln.
+1.66 mln.
3.35%
1 janv. 1970
53.42 mln.
+2.23 mln.
4.36%
1 janv. 1971
58.1 mln.
+4.68 mln.
8.76%
1 janv. 1972
66.7 mln.
+8.6 mln.
14.8%
1 janv. 1973
80.2 mln.
+13.5 mln.
20.24%
1 janv. 1974
109.1 mln.
+28.9 mln.
36.03%
1 janv. 1975
143.5 mln.
+34.4 mln.
31.53%
1 janv. 1976
173.6 mln.
+30.1 mln.
20.98%
1 janv. 1977
220.4 mln.
+46.8 mln.
26.96%
1 janv. 1978
275.1 mln.
+54.7 mln.
24.82%
1 janv. 1979
312.8 mln.
+37.7 mln.
13.7%
1 janv. 1980
372.3 mln.
+59.5 mln.
19.02%
1 janv. 1981
437.767 mln.
+65.467 mln.
17.58%
1 janv. 1982
530.418 mln.
+92.651 mln.
21.16%
Classement des pays selon les statistiques actuelles par années

Commentaires:

Envoyer
PremiumAbout & FeedbackUn accordConfidentialité
logo
© 2022 Selected Technologies LLC – Morgan Hill, California