29
/fr/
fr
AIzaSyAYiBZKx7MnpbEhh9jyipgxe19OcubqV5w
April 1, 2024
177640
Lesotho
LSO
true
2
1
Final consumption expenditure (current US$)
1982,1981,1980,1979,1978,1977,1976,1975,1974,1973,1972,1971,1970,1969,1968,1967,1966,1965,1964,1963,1962,1961
Download
Bibliothèque de statistiques globales →Lesotho →

Final consumption expenditure (current US$)

Cette statistique dans les autres pays:
AfghanistanAlbaniaAlgeriaAngolaAntigua and BarbudaArgentinaArmeniaArubaAustraliaAustriaAzerbaijanBahamas, TheBahrainBangladeshBarbadosBelarusBelgiumBelizeBeninBermudaBhutanBoliviaBosnia and HerzegovinaBotswanaBrazilBrunei DarussalamBulgariaBurkina FasoBurundiCabo VerdeCambodiaCameroonCanadaCentral African RepublicChadChileChinaColombiaComorosCongo, Dem. Rep.Congo, Rep.Costa RicaCote d'IvoireCroatiaCubaCyprusCzech RepublicDenmarkDjiboutiDominicaDominican RepublicEcuadorEgypt, Arab Rep.El SalvadorEquatorial GuineaEritreaEstoniaEthiopiaFaroe IslandsFijiFinlandFranceGabonGambia, TheGeorgiaGermanyGhanaGreeceGrenadaGuatemalaGuineaGuinea-BissauGuyanaHaitiHondurasHong Kong SAR, ChinaHungaryIcelandIndiaIndonesiaIran, Islamic Rep.IrelandIsraelItalyJamaicaJapanJordanKazakhstanKenyaKiribatiKorea, Rep.KosovoKuwaitKyrgyz RepublicLao PDRLatviaLebanonLesothoLiberiaLibyaLithuaniaLuxembourgMacao SAR, ChinaMacedonia, FYRMadagascarMalawiMalaysiaMaliMaltaMauritaniaMauritiusMexicoMicronesia, Fed. Sts.MoldovaMongoliaMontenegroMoroccoMozambiqueNamibiaNepalNetherlandsNew CaledoniaNew ZealandNicaraguaNigerNigeriaNorwayOmanPakistanPanamaPapua New GuineaParaguayPeruPhilippinesPolandPortugalPuerto RicoQatarRomaniaRussian FederationRwandaSaudi ArabiaSenegalSerbiaSeychellesSierra LeoneSingaporeSlovak RepublicSloveniaSolomon IslandsSomaliaSouth AfricaSouth SudanSpainSri LankaSt. Kitts and NevisSt. LuciaSt. Vincent and the GrenadinesSudanSurinameSwazilandSwedenSwitzerlandSyrian Arab RepublicTajikistanTanzaniaThailandTimor-LesteTogoTongaTrinidad and TobagoTunisiaTurkeyUgandaUkraineUnited Arab EmiratesUnited KingdomUnited StatesUruguayUzbekistanVanuatuVenezuela, RBVietnamWest Bank and GazaYemen, Rep.ZambiaZimbabwe
La ligne de temps
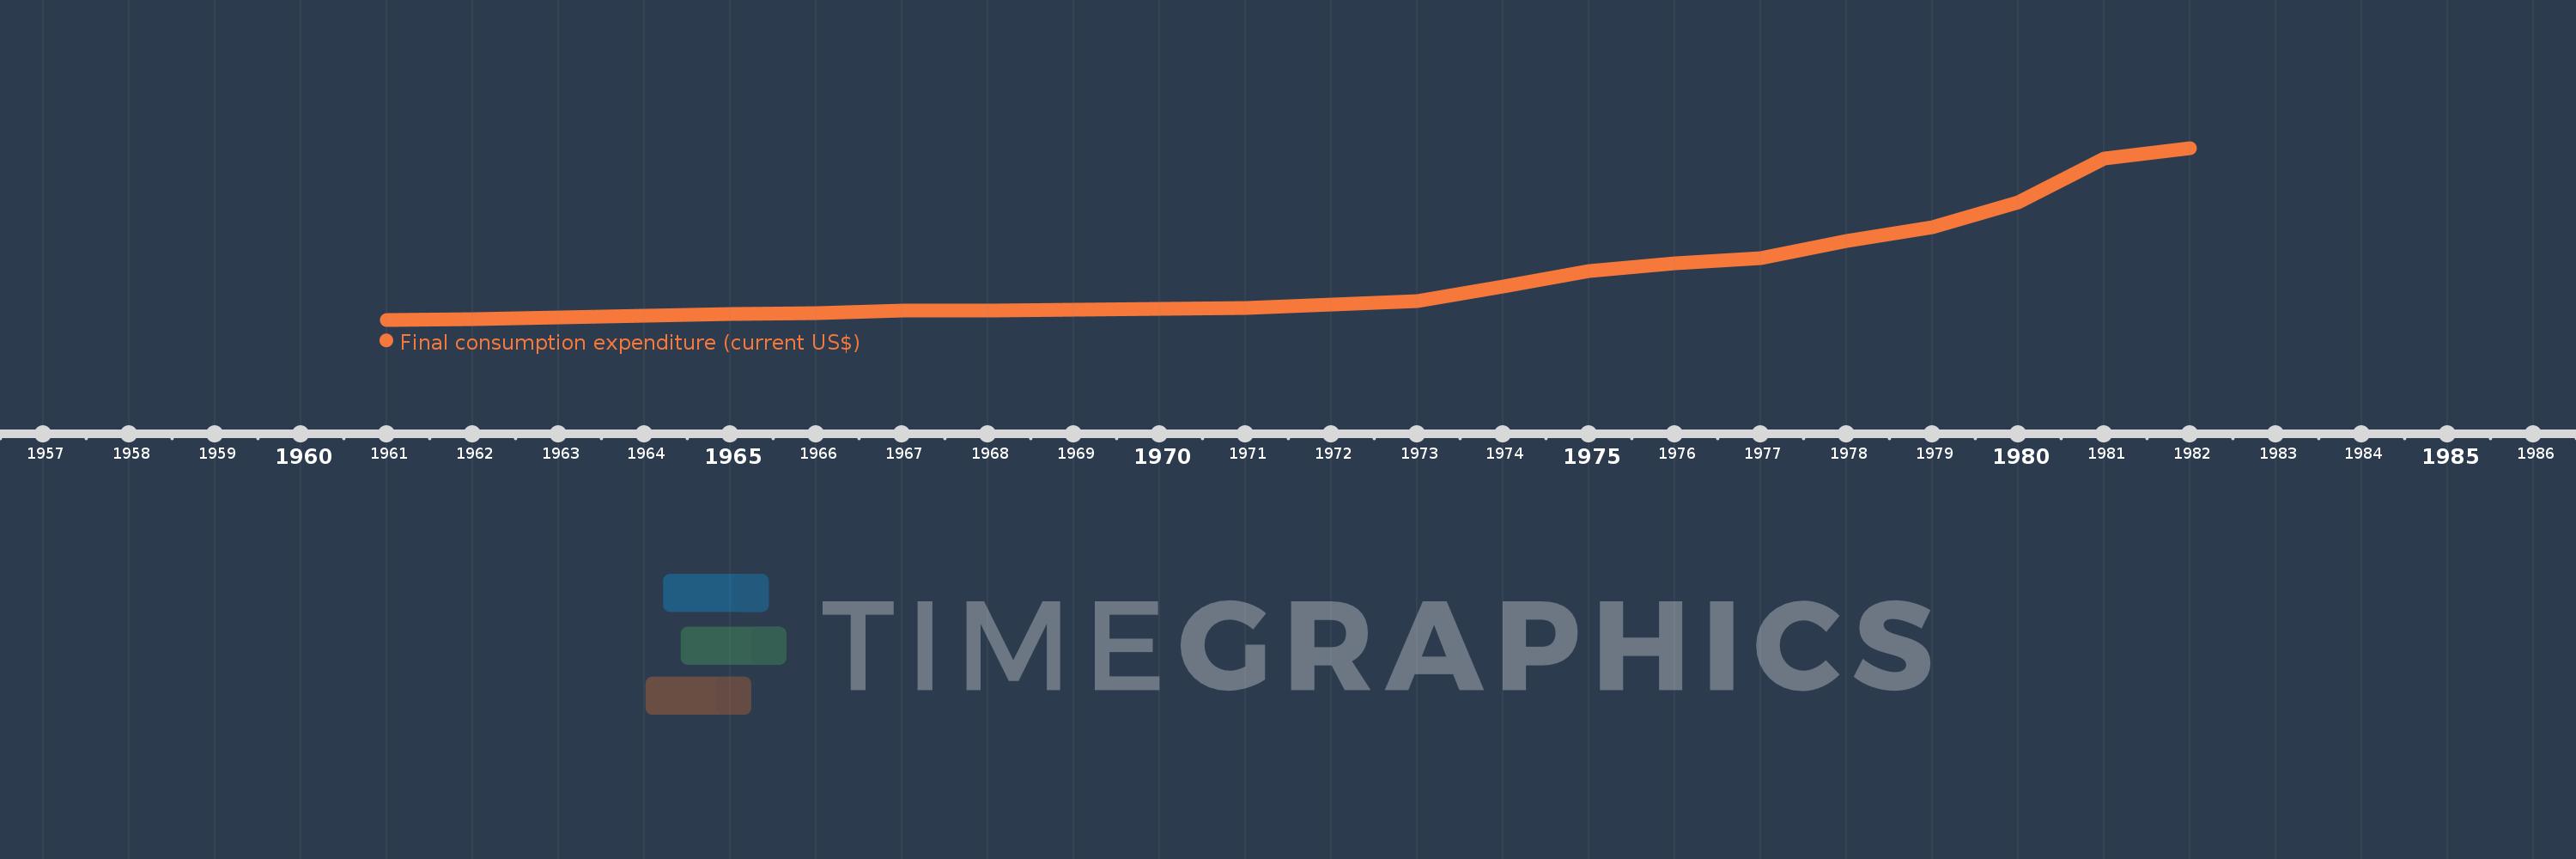
Cette échelle de temps montre un graphique de 1961 année à 1982 année Lesotho. Les données jusqu'à 1960 année ne sont pas présentés. Quantité d'observations actuelles selon dates: 22.
Source (désignation):
Les indicateurs du développement mondiale
Source (organisation):
World Bank national accounts data, and OECD National Accounts data files.
Catégories:
Economy & Growth
Dernière mise à jour
23 avr. 2017
Les indicateurs de changement de valeurs selon les années
En moyenne:
202.933 mln.
Minimum:
43.119 mln.
1 janv. 1961
Maximum:
695.211 mln.
1 janv. 1982
Pour la date d''observation
Valeur
Changement absolu
Le changement par rapport à la valeur précédente
1 janv. 1961
43.119 mln.
+43.119 mln.
0.0%
1 janv. 1962
46.059 mln.
+2.94 mln.
6.82%
1 janv. 1963
52.919 mln.
+6.86 mln.
14.89%
1 janv. 1964
59.919 mln.
+7.0 mln.
13.23%
1 janv. 1965
64.679 mln.
+4.76 mln.
7.94%
1 janv. 1966
69.299 mln.
+4.62 mln.
7.14%
1 janv. 1967
76.858 mln.
+7.56 mln.
10.91%
1 janv. 1968
78.86 mln.
+2.002 mln.
2.6%
1 janv. 1969
80.344 mln.
+1.484 mln.
1.88%
1 janv. 1970
83.326 mln.
+2.982 mln.
3.71%
1 janv. 1971
86.938 mln.
+3.612 mln.
4.33%
1 janv. 1972
101.65 mln.
+14.712 mln.
16.92%
1 janv. 1973
114.739 mln.
+13.089 mln.
12.88%
1 janv. 1974
168.732 mln.
+53.993 mln.
47.06%
1 janv. 1975
227.373 mln.
+58.641 mln.
34.75%
1 janv. 1976
256.389 mln.
+29.016 mln.
12.76%
1 janv. 1977
275.299 mln.
+18.91 mln.
7.38%
1 janv. 1978
341.651 mln.
+66.352 mln.
24.1%
1 janv. 1979
395.354 mln.
+53.703 mln.
15.72%
1 janv. 1980
489.667 mln.
+94.313 mln.
23.86%
1 janv. 1981
656.137 mln.
+166.469 mln.
34.0%
1 janv. 1982
695.211 mln.
+39.074 mln.
5.96%
Classement des pays selon les statistiques actuelles par années

Commentaires:

Envoyer
PremiumAbout & FeedbackUn accordConfidentialité
logo
© 2022 Selected Technologies LLC – Morgan Hill, California