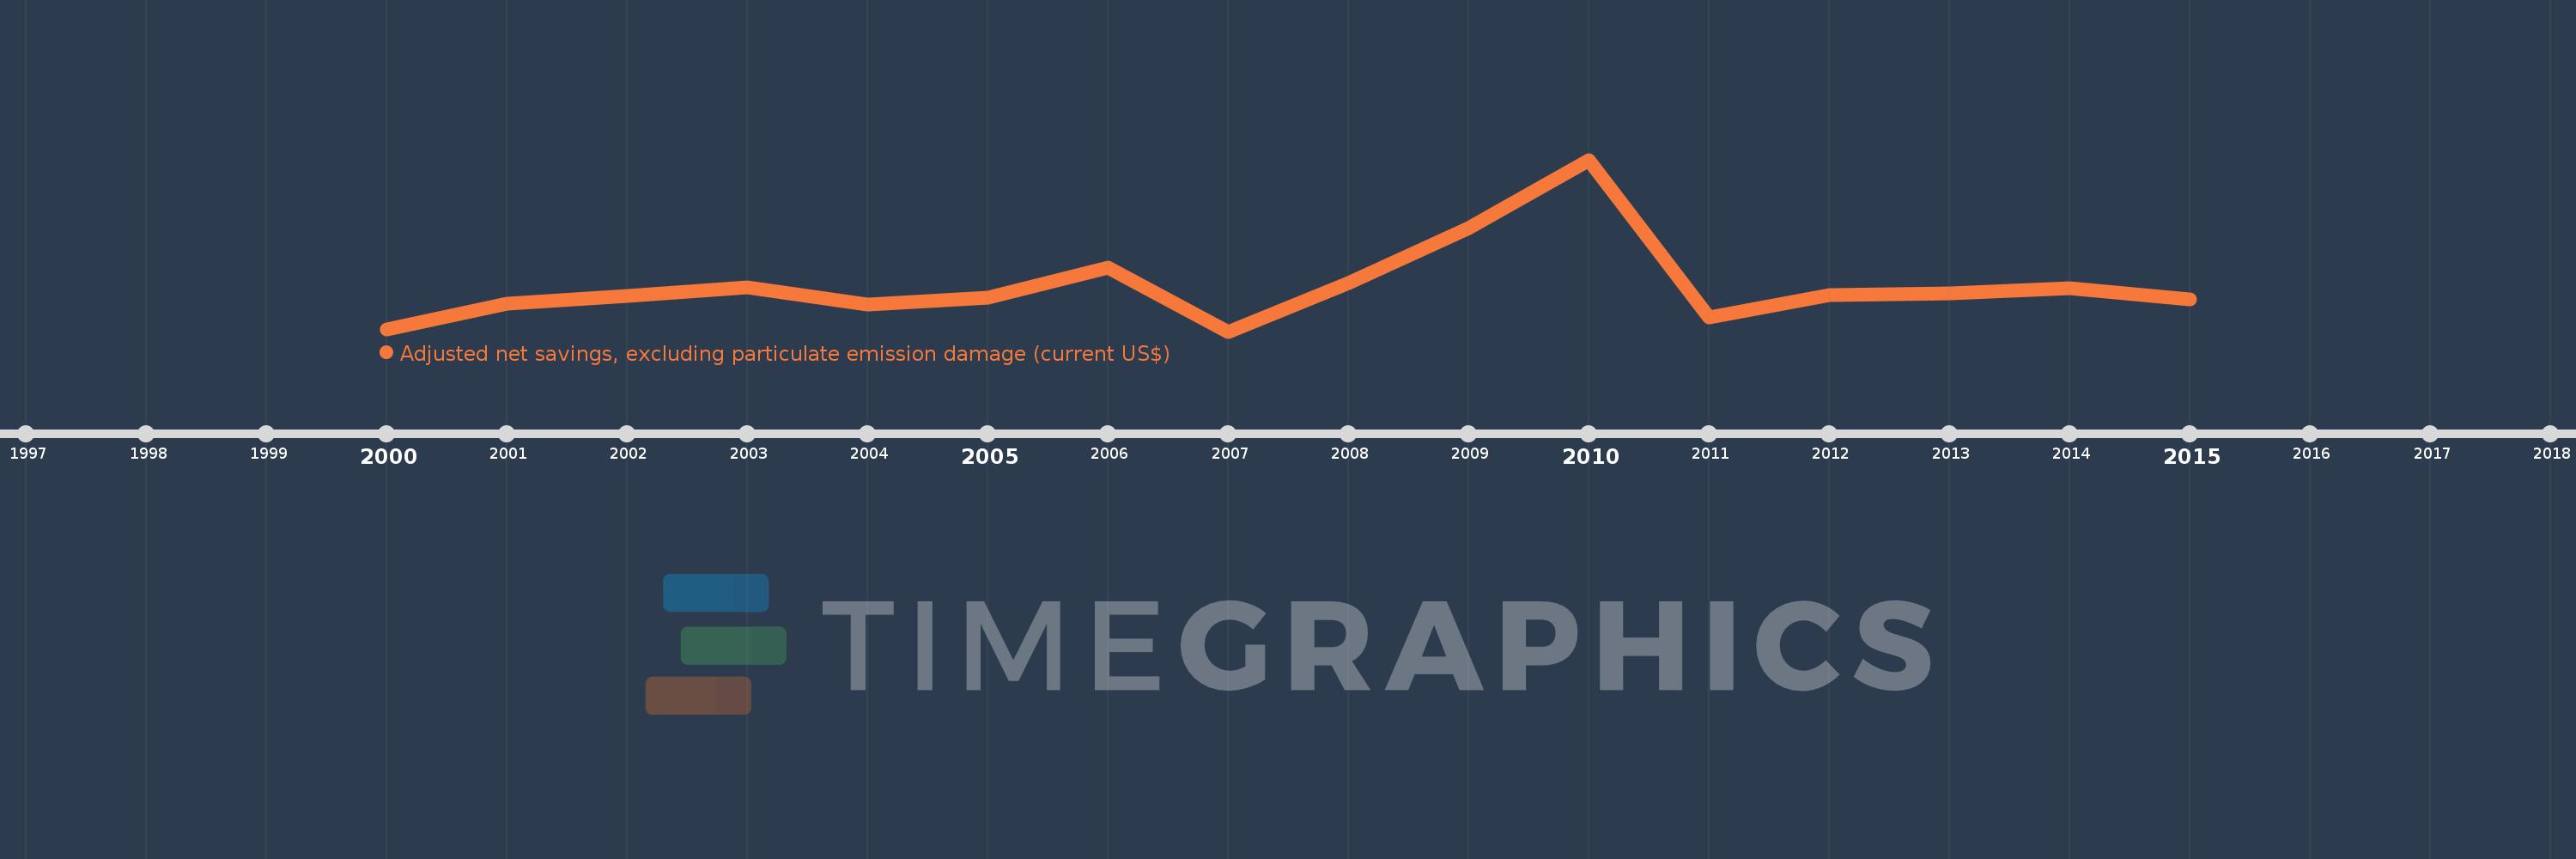
Cette échelle de temps montre un graphique de 2000 année à 2015 année Latvia. Les données jusqu'à 1999 année ne sont pas présentés. Quantité d'observations actuelles selon dates: 16.
Source (désignation):
Les indicateurs du développement mondiale
Source (organisation):
World Bank staff estimates based on sources and methods in World Bank's "The Changing Wealth of Nations: Measuring Sustainable Development in the New Millennium" (2011).
Catégories:
Economy & Growth, Environment
Dernière mise à jour
23 avr. 2017
Les indicateurs de changement de valeurs selon les années
En moyenne:
376.952 mln.
Minimum:
-406.227 mln.
1 janv. 2007
Maximum:
2.566 mds
1 janv. 2010
Pour la date d''observation
Valeur
Changement absolu
Le changement par rapport à la valeur précédente
1 janv. 2000
-368.717 mln.
-368.717 mln.
0.0%
1 janv. 2001
75.302 mln.
+444.019 mln.
-120.42%
1 janv. 2002
215.353 mln.
+140.051 mln.
185.98%
1 janv. 2003
362.789 mln.
+147.436 mln.
68.46%
1 janv. 2004
61.178 mln.
-301.611 mln.
-83.14%
1 janv. 2005
182.461 mln.
+121.283 mln.
198.25%
1 janv. 2006
701.295 mln.
+518.834 mln.
284.35%
1 janv. 2007
-406.227 mln.
-1.108 mds
-157.93%
1 janv. 2008
430.83 mln.
+837.057 mln.
-206.06%
1 janv. 2009
1.38 mds
+949.648 mln.
220.42%
1 janv. 2010
2.566 mds
+1.185 mds
85.85%
1 janv. 2011
-154.697 mln.
-2.72 mds
-106.03%
1 janv. 2012
222.752 mln.
+377.449 mln.
-243.99%
1 janv. 2013
261.803 mln.
+39.051 mln.
17.53%
1 janv. 2014
344.726 mln.
+82.923 mln.
31.67%
1 janv. 2015
156.27 mln.
-188.456 mln.
-54.67%
Classement des pays selon les statistiques actuelles par années