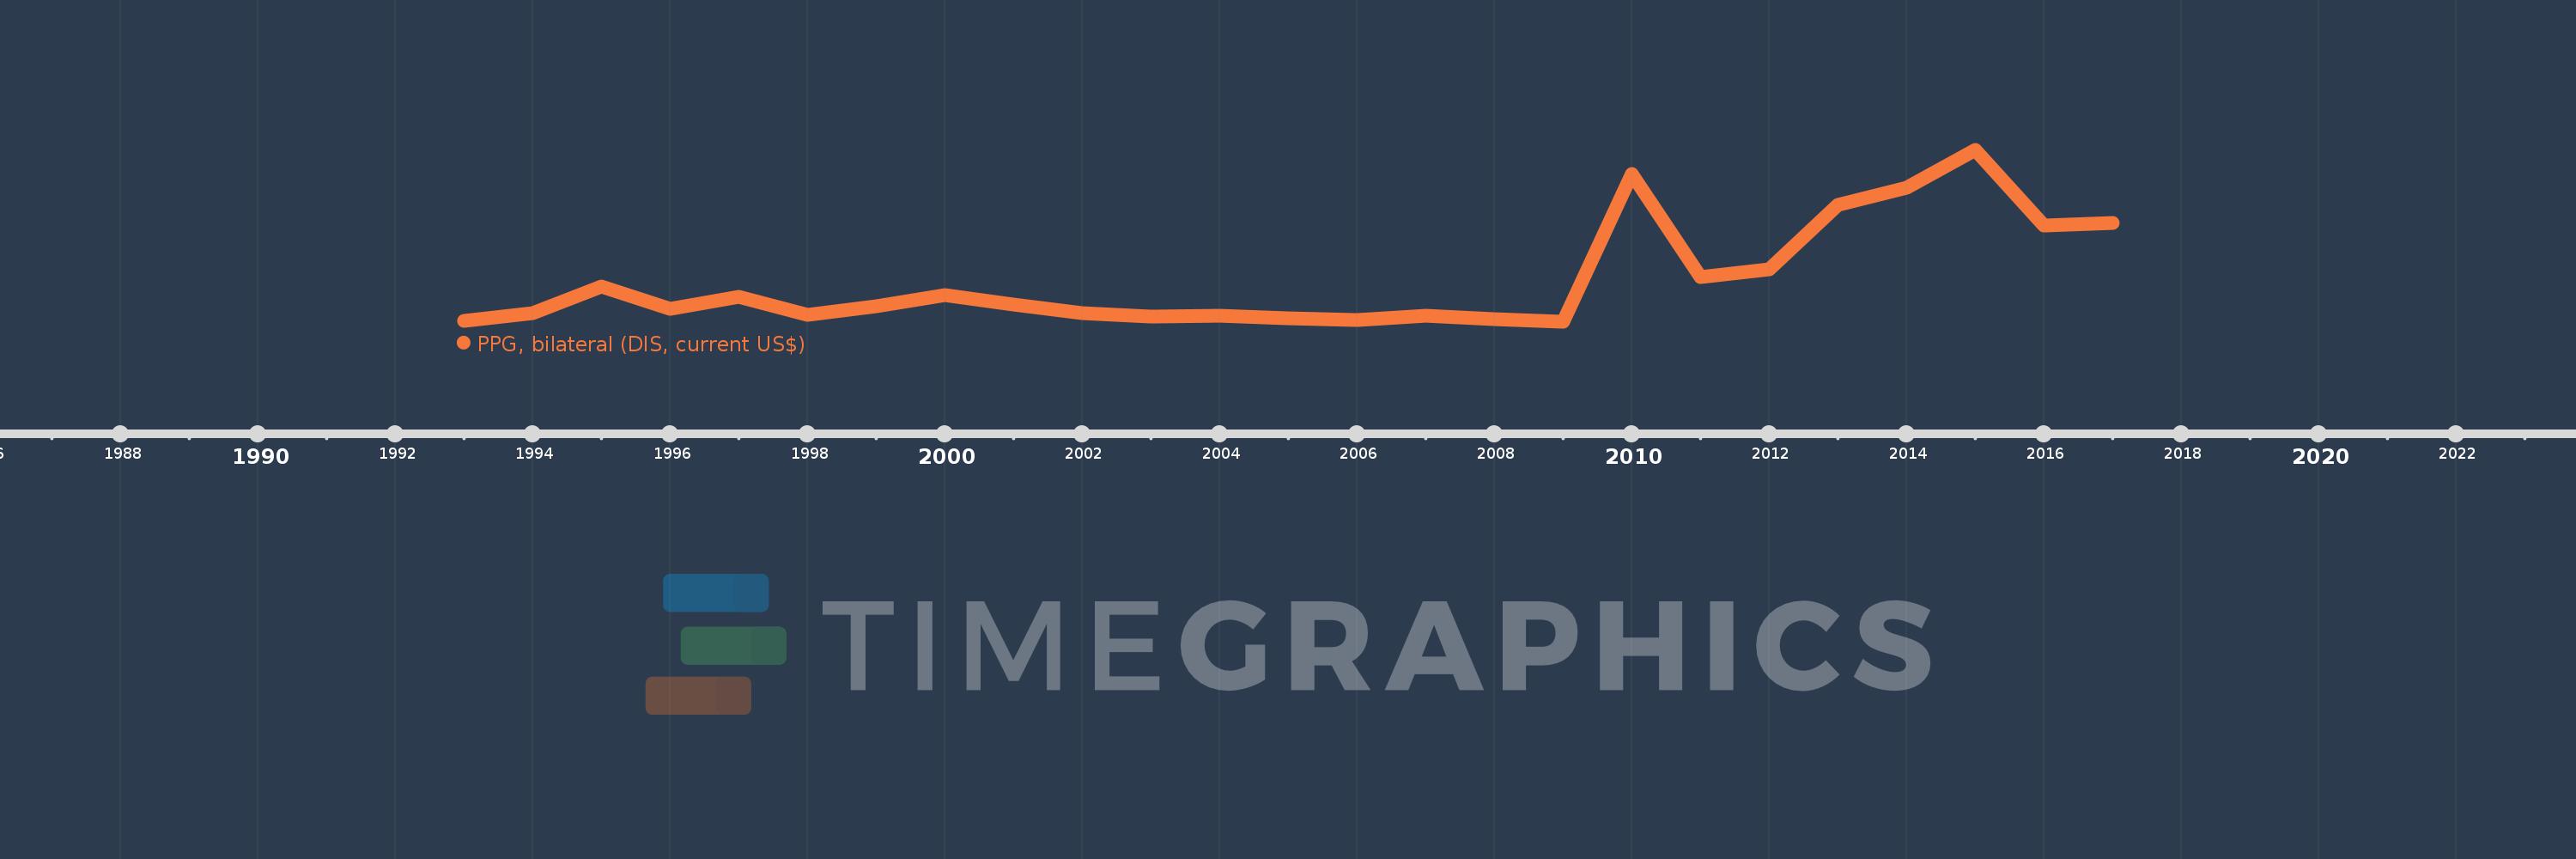
Cette échelle de temps montre un graphique de 1993 année à 2017 année Kyrgyz Republic. Les données jusqu'à 1992 année ne sont pas présentés. Quantité d'observations actuelles selon dates: 25.
Source (désignation):
Les indicateurs du développement mondiale
Source (organisation):
World Bank, International Debt Statistics.
Catégories:
External Debt
Dernière mise à jour
23 avr. 2017
Les indicateurs de changement de valeurs selon les années
En moyenne:
96.65 mln.
Minimum:
1.186 mln.
1 janv. 2009
Maximum:
391.046 mln.
1 janv. 2015
Pour la date d''observation
Valeur
Changement absolu
Le changement par rapport à la valeur précédente
1 janv. 1993
3.794 mln.
+3.794 mln.
0.0%
1 janv. 1994
21.73 mln.
+17.936 mln.
472.75%
1 janv. 1995
82.356 mln.
+60.626 mln.
279.0%
1 janv. 1996
30.897 mln.
-51.459 mln.
-62.48%
1 janv. 1997
58.498 mln.
+27.601 mln.
89.33%
1 janv. 1998
16.421 mln.
-42.077 mln.
-71.93%
1 janv. 1999
37.195 mln.
+20.774 mln.
126.51%
1 janv. 2000
61.82 mln.
+24.625 mln.
66.21%
1 janv. 2001
41.55 mln.
-20.27 mln.
-32.79%
1 janv. 2002
20.484 mln.
-21.066 mln.
-50.7%
1 janv. 2003
13.422 mln.
-7.062 mln.
-34.48%
1 janv. 2004
15.429 mln.
+2.007 mln.
14.95%
1 janv. 2005
10.054 mln.
-5.375 mln.
-34.84%
1 janv. 2006
5.985 mln.
-4.069 mln.
-40.47%
1 janv. 2007
14.521 mln.
+8.536 mln.
142.62%
1 janv. 2008
7.992 mln.
-6.529 mln.
-44.96%
1 janv. 2009
1.186 mln.
-6.806 mln.
-85.16%
1 janv. 2010
337.686 mln.
+336.5 mln.
28.37 milles%
1 janv. 2011
104.039 mln.
-233.647 mln.
-69.19%
1 janv. 2012
121.2 mln.
+17.161 mln.
16.49%
1 janv. 2013
266.823 mln.
+145.623 mln.
120.15%
1 janv. 2014
306.689 mln.
+39.866 mln.
14.94%
1 janv. 2015
391.046 mln.
+84.357 mln.
27.51%
1 janv. 2016
219.565 mln.
-171.481 mln.
-43.85%
1 janv. 2017
225.865 mln.
+6.3 mln.
2.87%
Classement des pays selon les statistiques actuelles par années