33
/fr/
AIzaSyB4mHJ5NPEv-XzF7P6NDYXjlkCWaeKw5bc
November 1, 2025
165581
Jordan
JOR
true
2
1
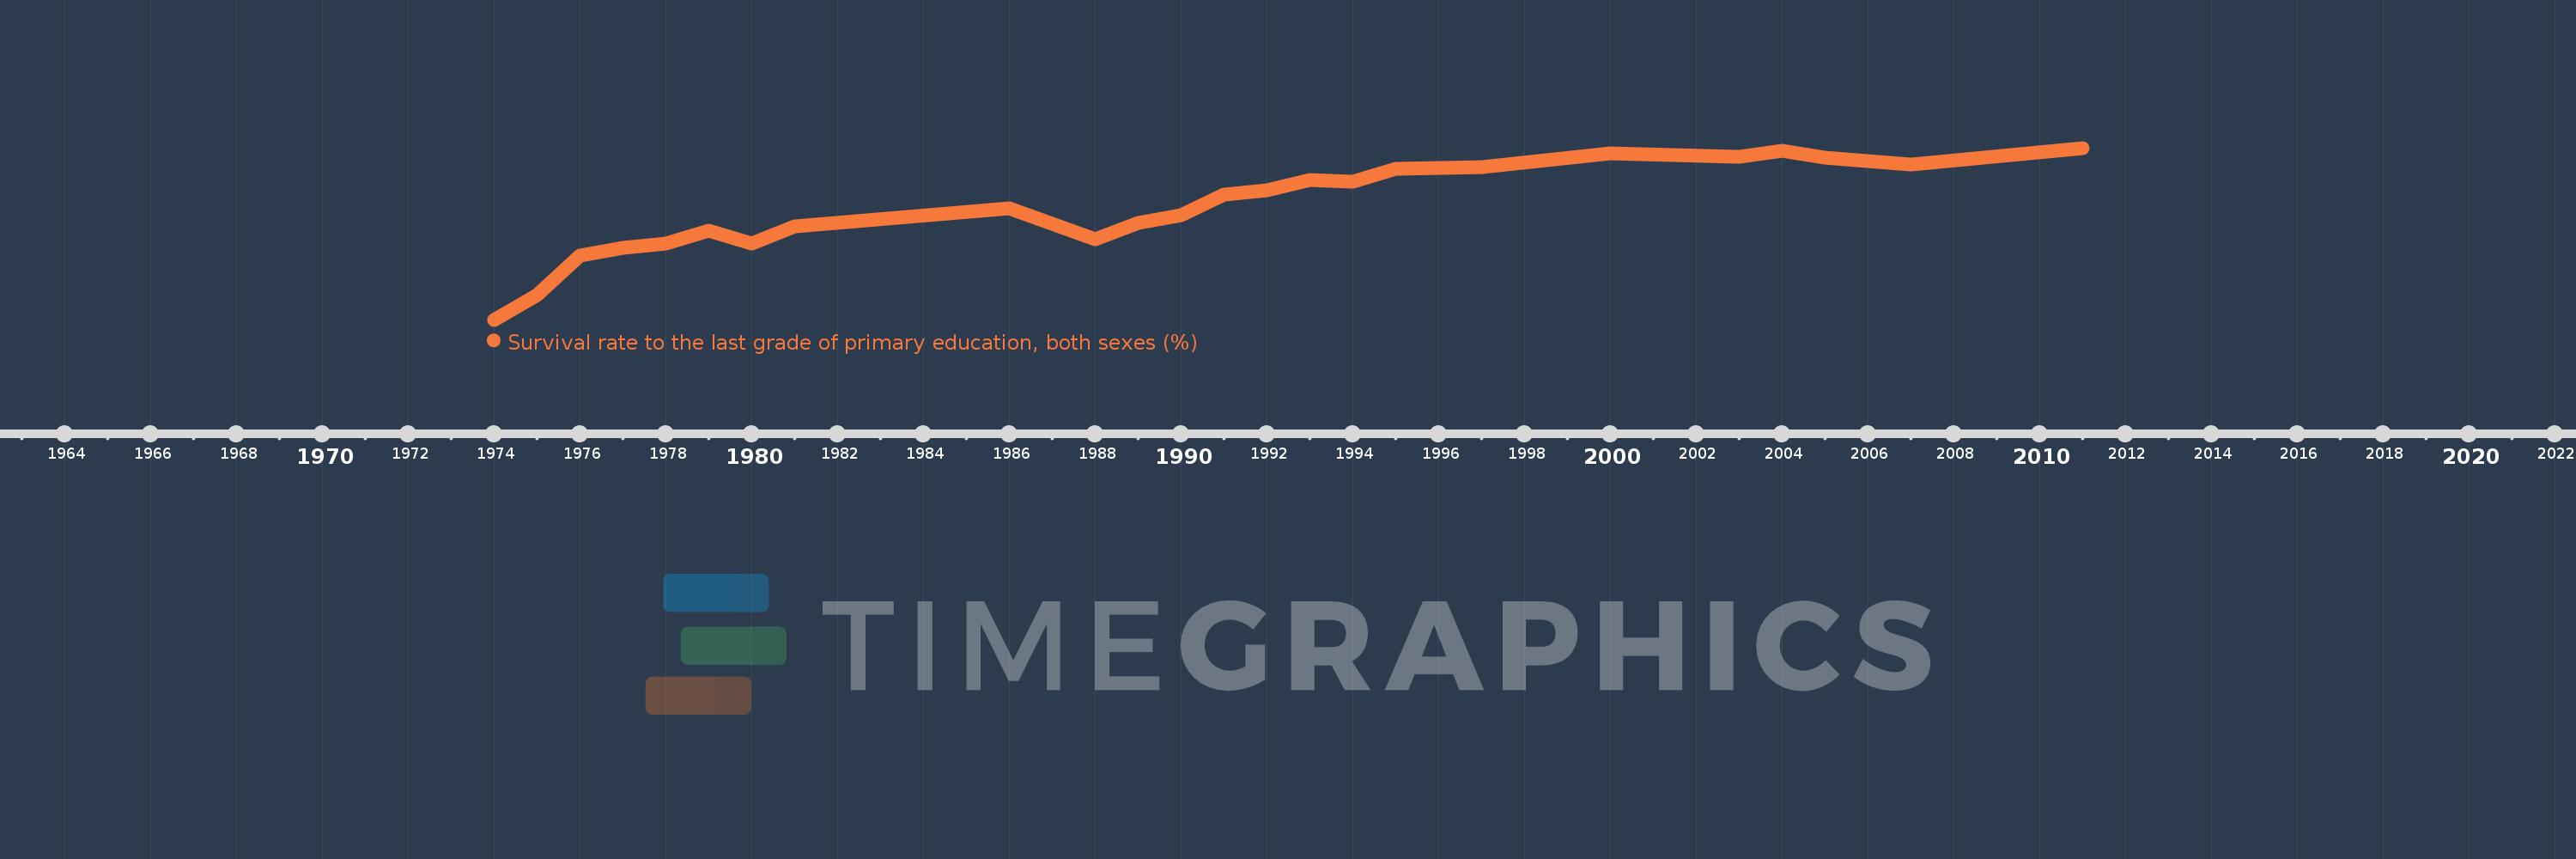
Survival rate to the last grade of primary education, both sexes (%)
2011,2007,2005,2004,2003,2000,1997,1995,1994,1993,1992,1991,1990,1989,1988,1986,1981,1980,1979,1978,1977,1976,1975,1974